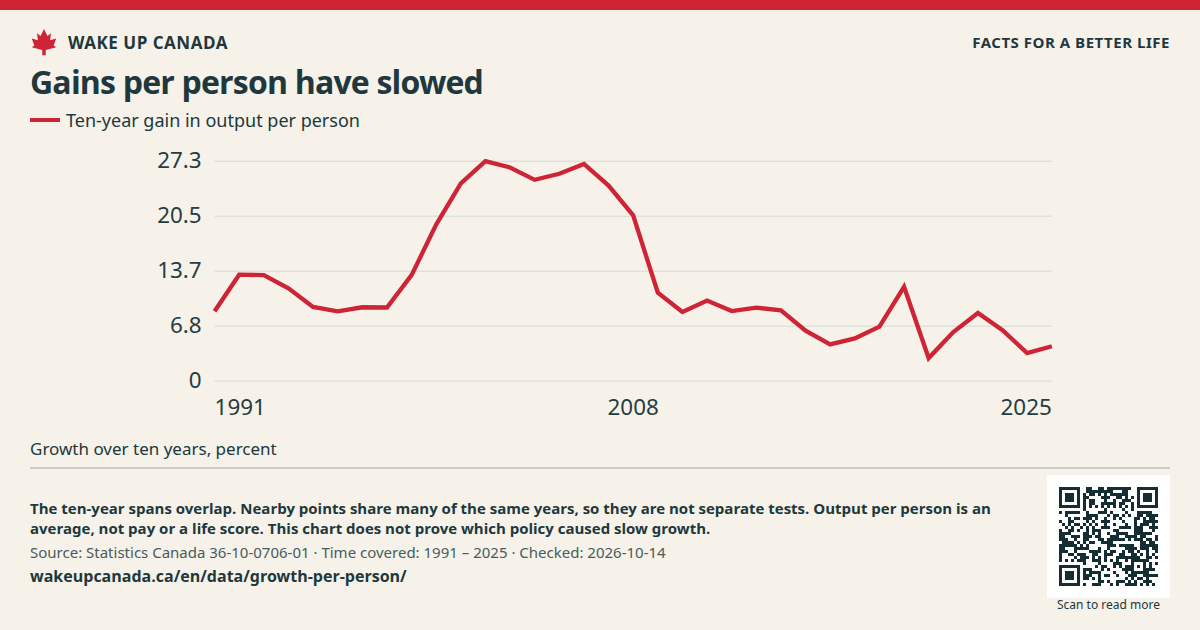
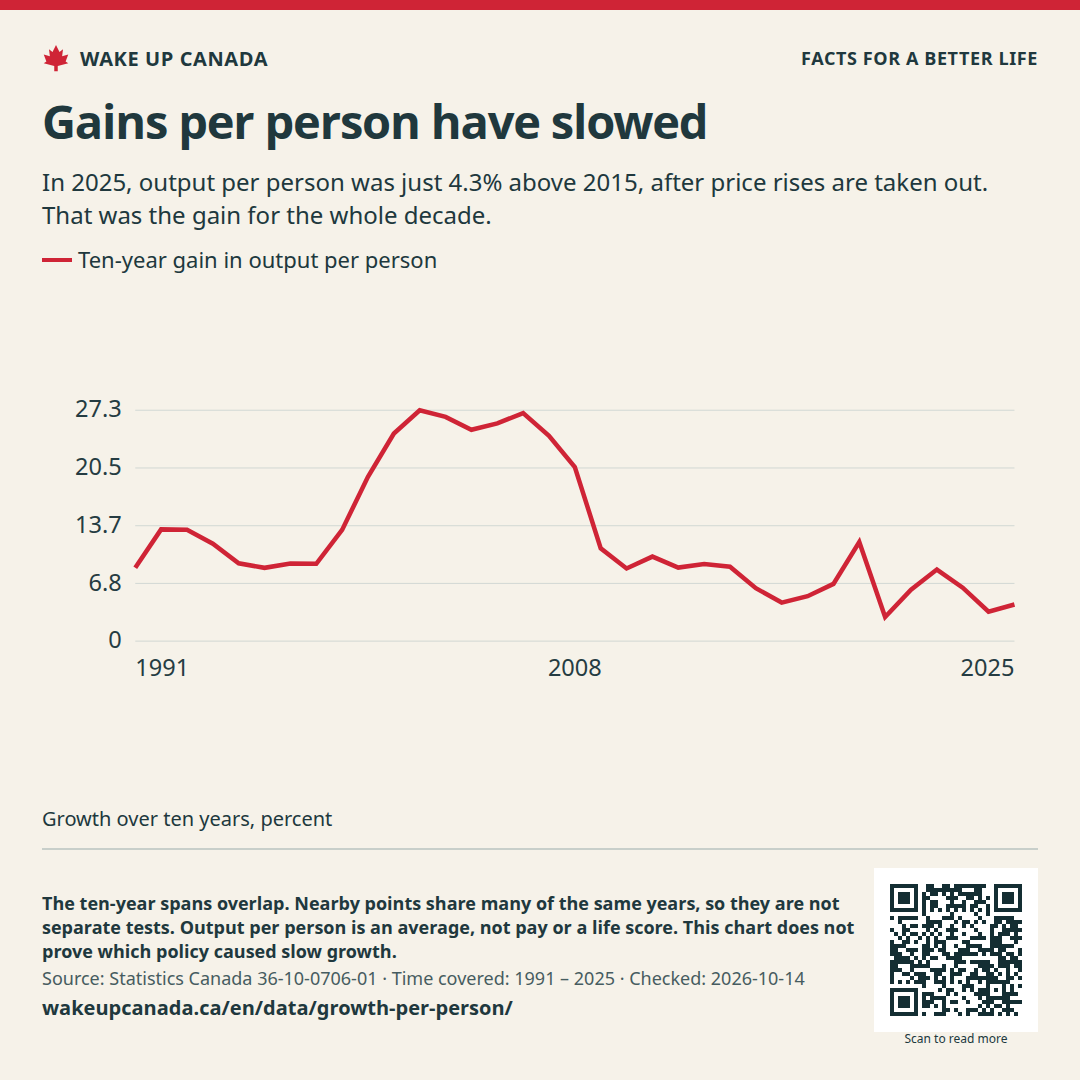
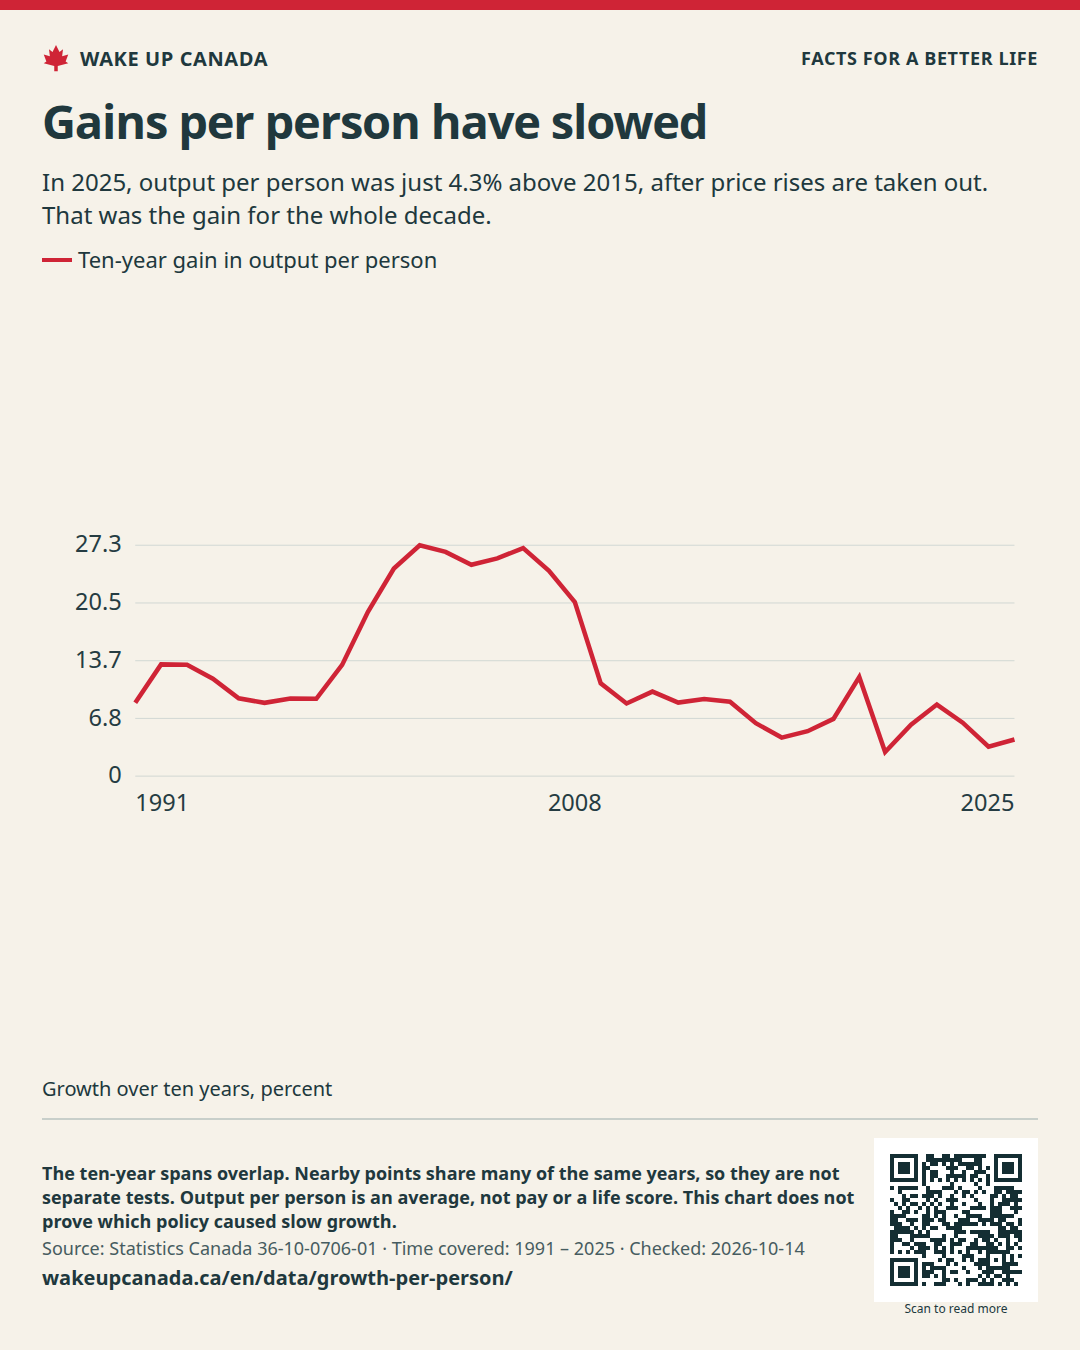
In 2025, output per person was just 4.3% above 2015, after price rises are taken out. That was the gain for the whole decade.
How much did output per person grow in ten years?
Time covered: 1991 — 2025
Showing: 1991 — 2025
Ten-year gain in output per person
4.3Last point · Growth over ten years, percent
Ten-year gain in output per person 4.3
3022.5157.50
19912025
Growth over ten years, percent
Each point shows the gain over the ten years ending in that year. The first point compares 1991 with 1981. The last compares 2025 with 2015. Above zero means output per person grew.
Checked:
See all the data
This table has the same values as the chart. You can scroll the table sideways.
How much did output per person grow in ten years? · Growth over ten years, percent
In 2025, output per person was just 4.3% above 2015, after price rises are taken out. That was the gain for the whole decade.
Keep the source, date and notes with the image.
Checked:
What this does not show: The ten-year spans overlap. Nearby points share many of the same years, so they are not separate tests. Output per person is an average, not pay or a life score. This chart does not prove which policy caused slow growth.