Why this matters
We want families to keep more of their pay. Show how each proposed cut changes a clear family budget.
What we want to change
Lower taxes at every level. Show which families gain and how to pay for each cut.
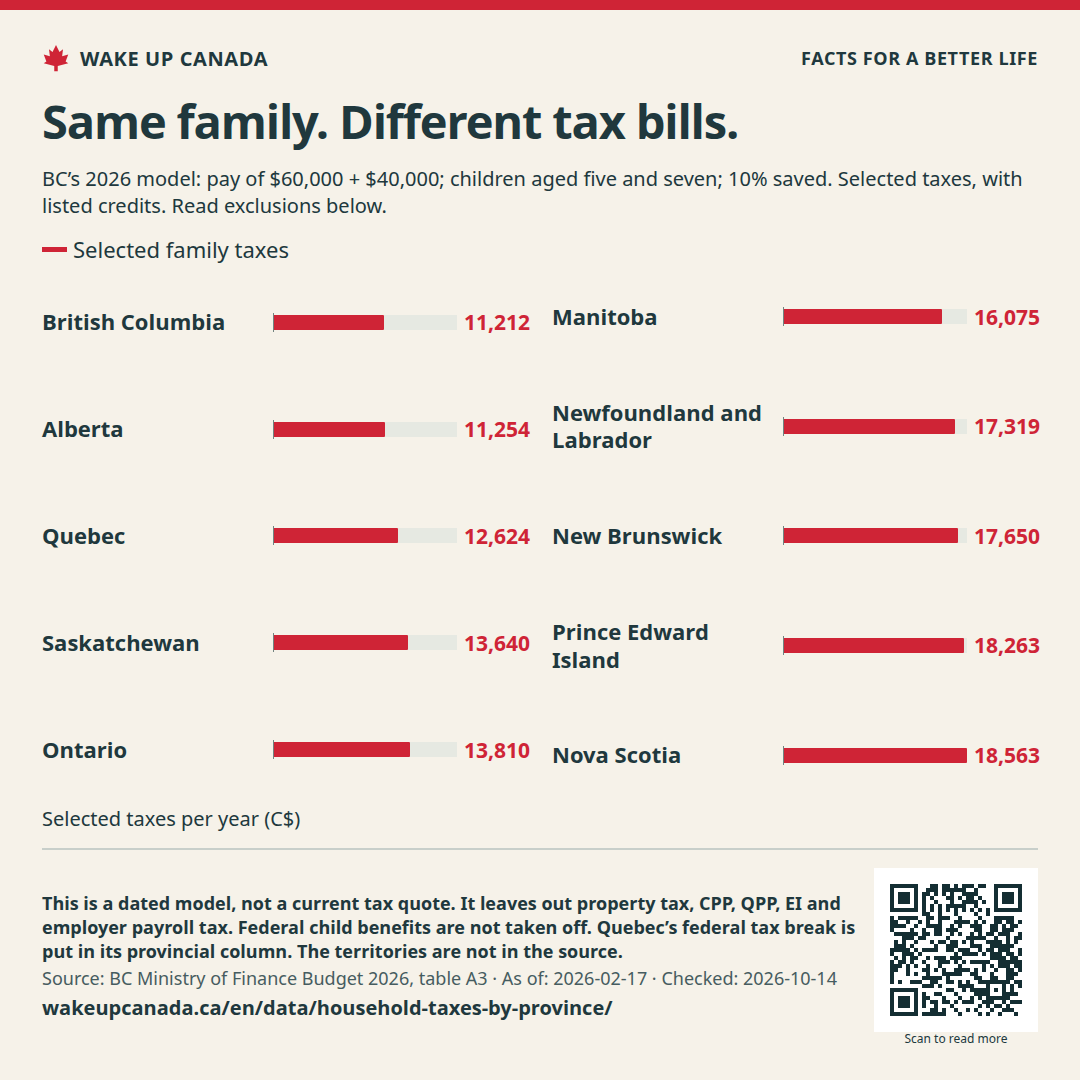
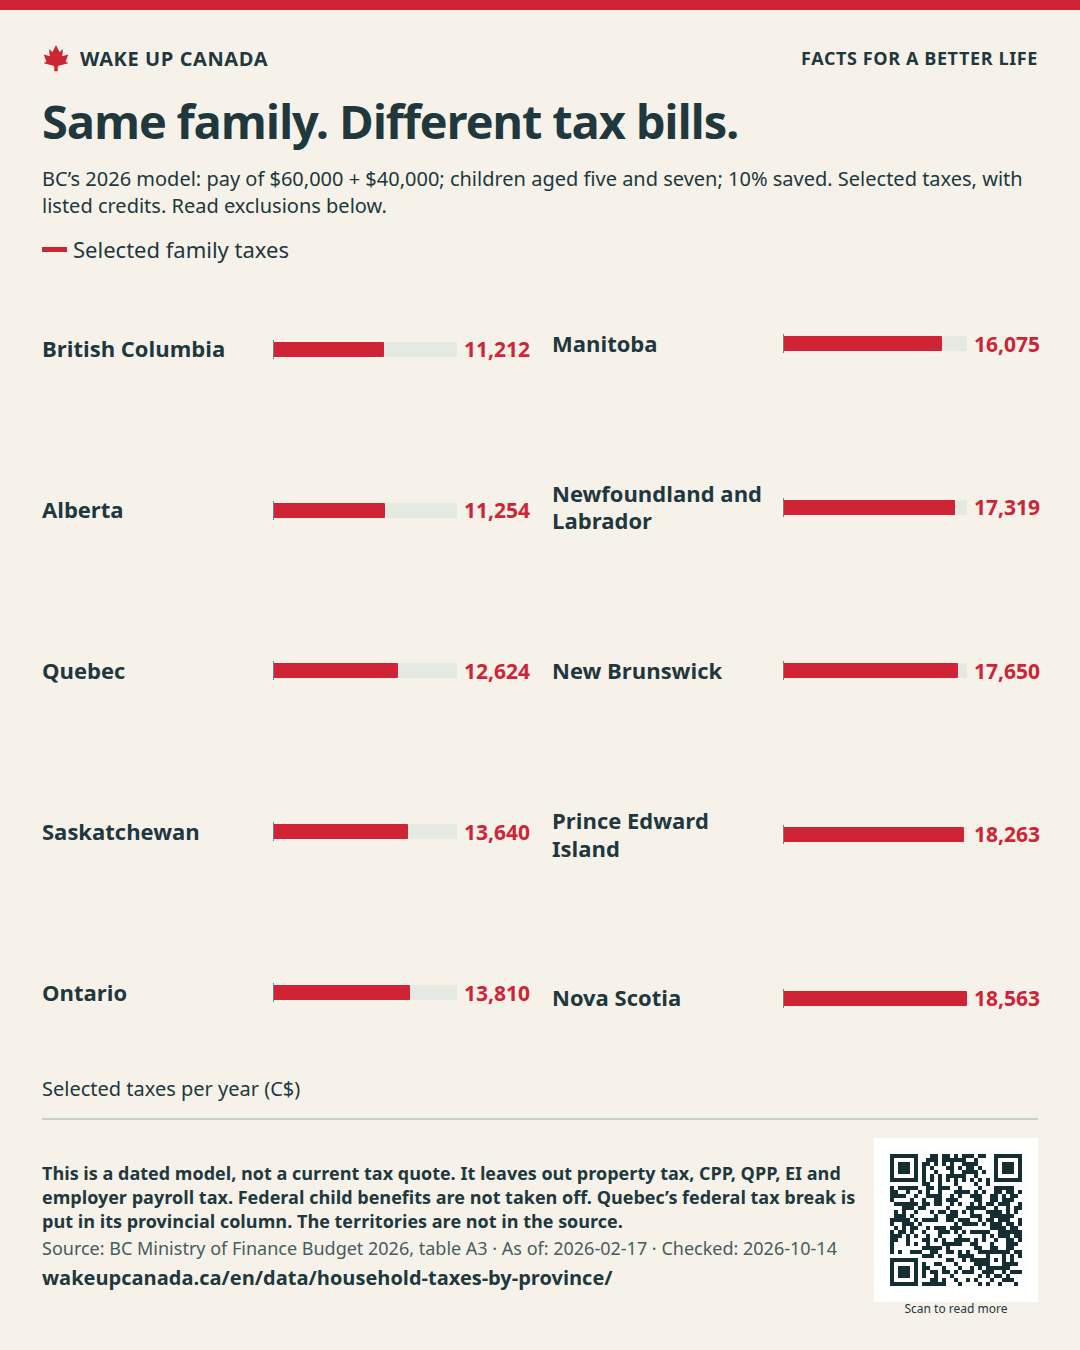
This case has two adults and two children. The adults earn $60,000 and $40,000. Compare the same family across all ten provinces.
As of: Feb 17, 2026
Selected taxes per year (C$)
Ten bars show the selected yearly tax bill for a fixed family case in BC’s Budget 2026 model.
Checked:
This table has the same values as the chart. You can scroll the table sideways.
| Time | Place | Selected family taxes |
|---|---|---|
| 2026 | British Columbia | 11,212 |
| 2026 | Alberta | 11,254 |
| 2026 | Saskatchewan | 13,640 |
| 2026 | Manitoba | 16,075 |
| 2026 | Ontario | 13,810 |
| 2026 | Quebec | 12,624 |
| 2026 | New Brunswick | 17,650 |
| 2026 | Nova Scotia | 18,563 |
| 2026 | Prince Edward Island | 18,263 |
| 2026 | Newfoundland and Labrador | 17,319 |
We want families to keep more of their pay. Show how each proposed cut changes a clear family budget.
Lower taxes at every level. Show which families gain and how to pay for each cut.
Source released:
WAKE UP CANADA
Help more people see the facts and the plan.
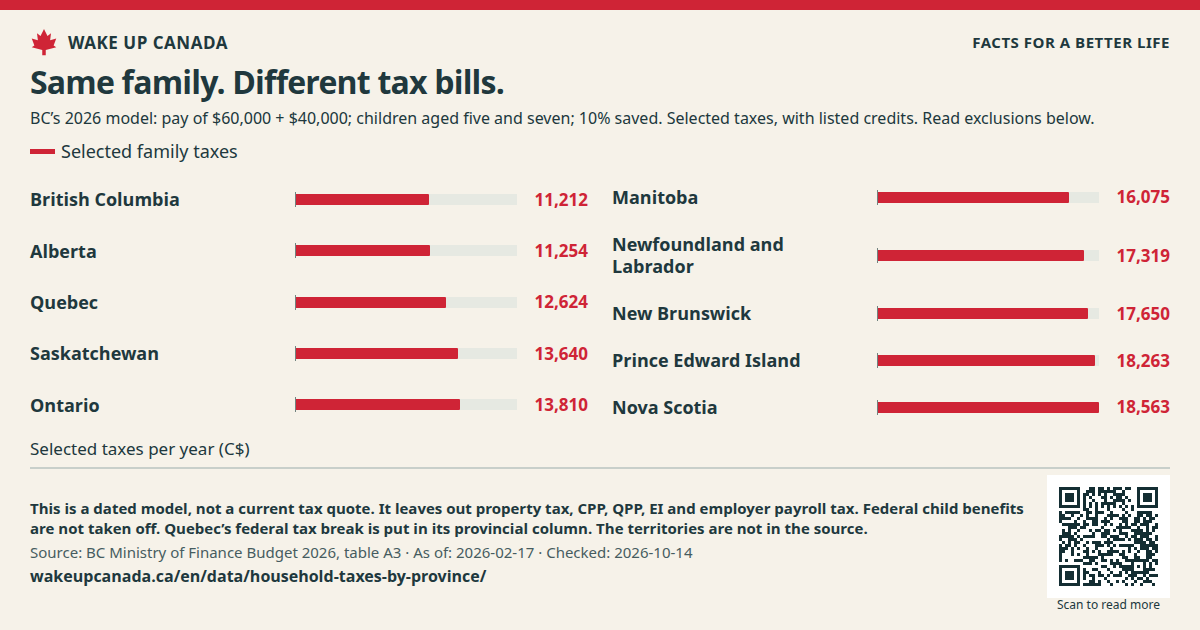
This case has two adults and two children. The adults earn $60,000 and $40,000. Compare the same family across all ten provinces.
Keep the source, date and notes with the image.
Checked:
What this does not show: This is a dated model, not a current tax quote. It leaves out property tax, CPP, QPP, EI and employer payroll tax. Federal child benefits are not taken off. Quebec’s federal tax break is put in its provincial column. The territories are not in the source.
No account needed. Sharing does not sign you up for email.

If the image opens in a new tab, press and hold it or use your browser’s save tool.