Why this matters
Weak investment can hold back pay and output. Firms need a fair chance to start, compete and grow.
What we want to change
Open markets and make useful projects easier to build. Test support by results, with access open to all.
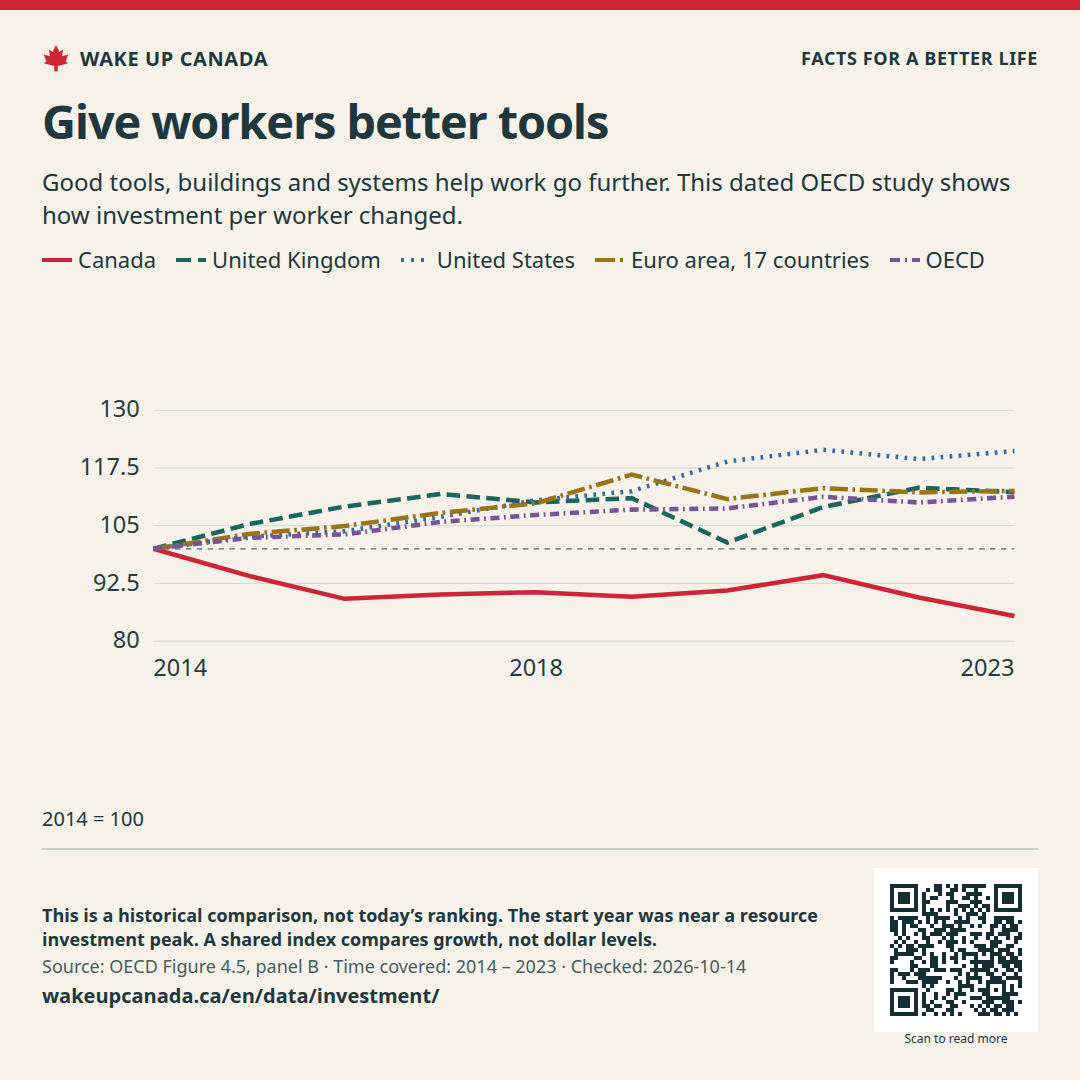
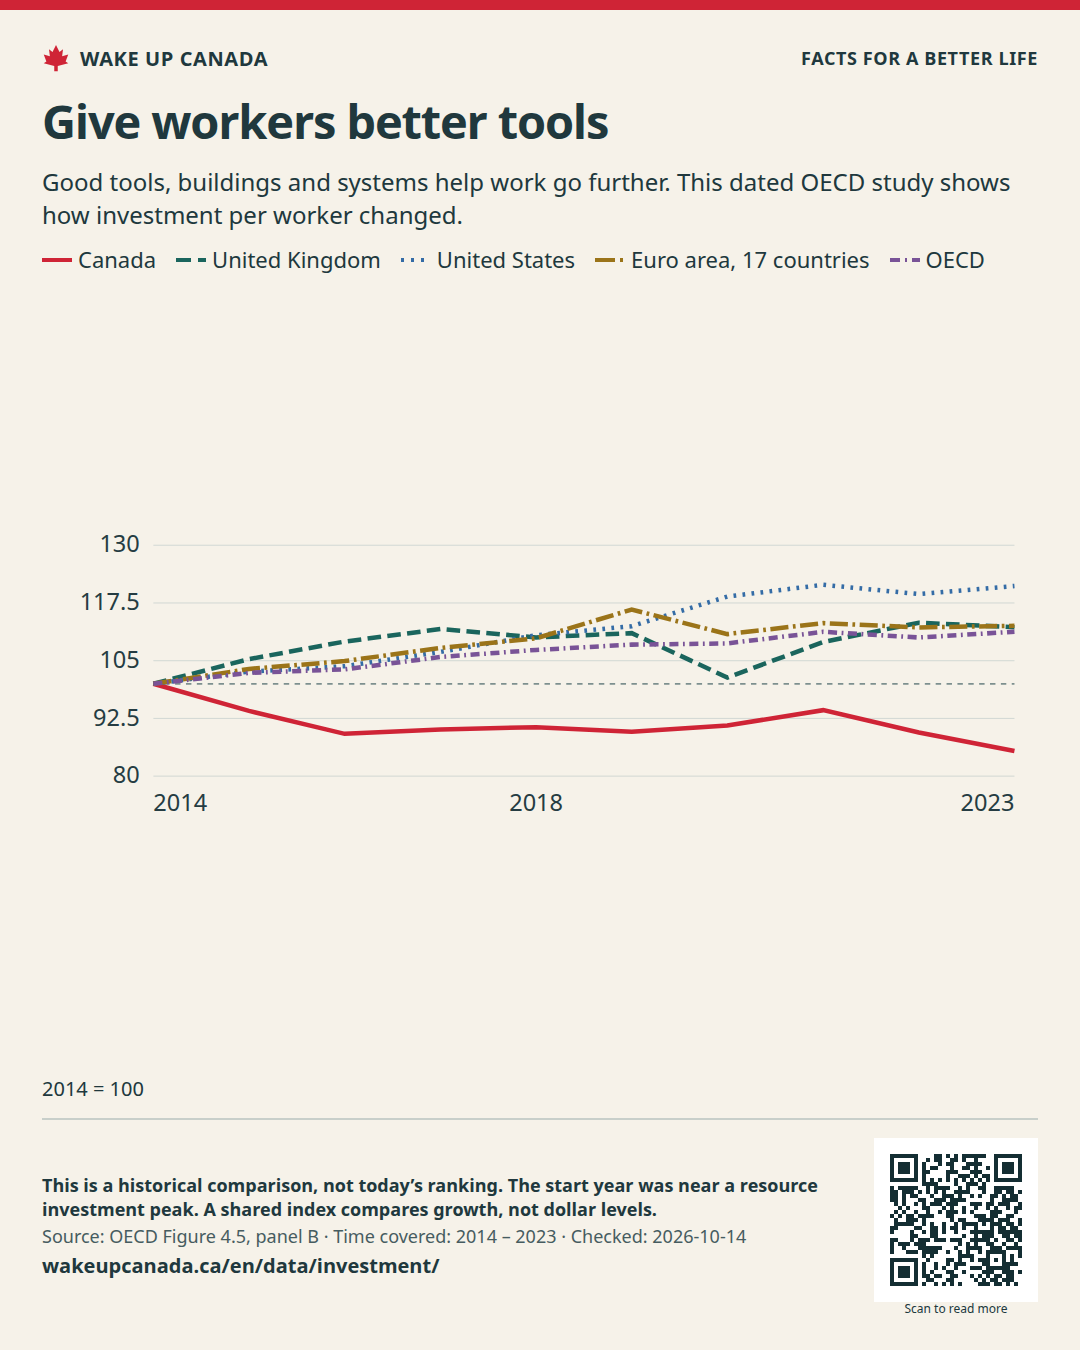
Good tools, buildings and systems help work go further. This dated OECD study shows how investment per worker changed.
Time covered: 2014 — 2023
Showing: 2014 — 2023
Canada
85.4Last point · 2014 = 100United Kingdom
112.2Last point · 2014 = 100United States
121.2Last point · 2014 = 100Euro area, 17 countries
112.6Last point · 2014 = 100OECD
111.3Last point · 2014 = 1002014 = 100
Five lines compare real total investment per worker from 2014 to 2023, with 2014 set to 100.
Dated study · Checked:
This table has the same values as the chart. You can scroll the table sideways.
| Time | Canada | United Kingdom | United States | Euro area, 17 countries | OECD |
|---|---|---|---|---|---|
| 2014 | 100 | 100 | 100 | 100 | 100 |
| 2015 | 94.123 | 105.3437 | 102.6292 | 103.2065 | 102.3774 |
| 2016 | 89.1606 | 109.143 | 103.8009 | 104.92 | 103.1135 |
| 2017 | 90.1154 | 111.8493 | 106.8966 | 107.761 | 105.7993 |
| 2018 | 90.5997 | 110.0408 | 110.5181 | 109.8473 | 107.3336 |
| 2019 | 89.6074 | 110.9678 | 112.4728 | 116.0739 | 108.477 |
| 2020 | 90.9699 | 101.3489 | 118.8946 | 110.7633 | 108.7433 |
| 2021 | 94.2894 | 109.0455 | 121.4361 | 113.1377 | 111.2518 |
| 2022 | 89.4595 | 113.2296 | 119.4286 | 112.2078 | 110.0228 |
| 2023 | 85.4364 | 112.246 | 121.1781 | 112.5518 | 111.2763 |
Weak investment can hold back pay and output. Firms need a fair chance to start, compete and grow.
Open markets and make useful projects easier to build. Test support by results, with access open to all.
Source released:
WAKE UP CANADA
Help more people see the facts and the plan.
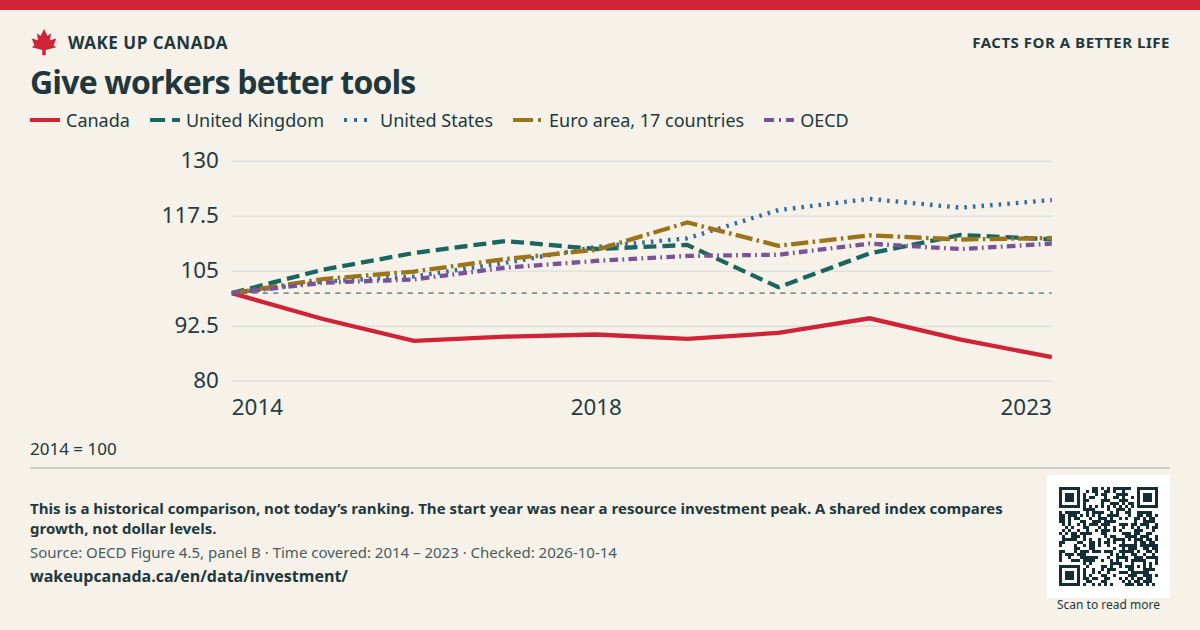
Good tools, buildings and systems help work go further. This dated OECD study shows how investment per worker changed.
Keep the source, date and notes with the image.
Checked:
What this does not show: This is a historical comparison, not today’s ranking. The start year was near a resource investment peak. A shared index compares growth, not dollar levels.
No account needed. Sharing does not sign you up for email.

If the image opens in a new tab, press and hold it or use your browser’s save tool.