Why this matters
When people cannot find a home near good work, they lose time and choices. Total city output is one part of that story.
What we want to change
Allow more homes and shops near jobs. Make daily trips safe, easy and short.
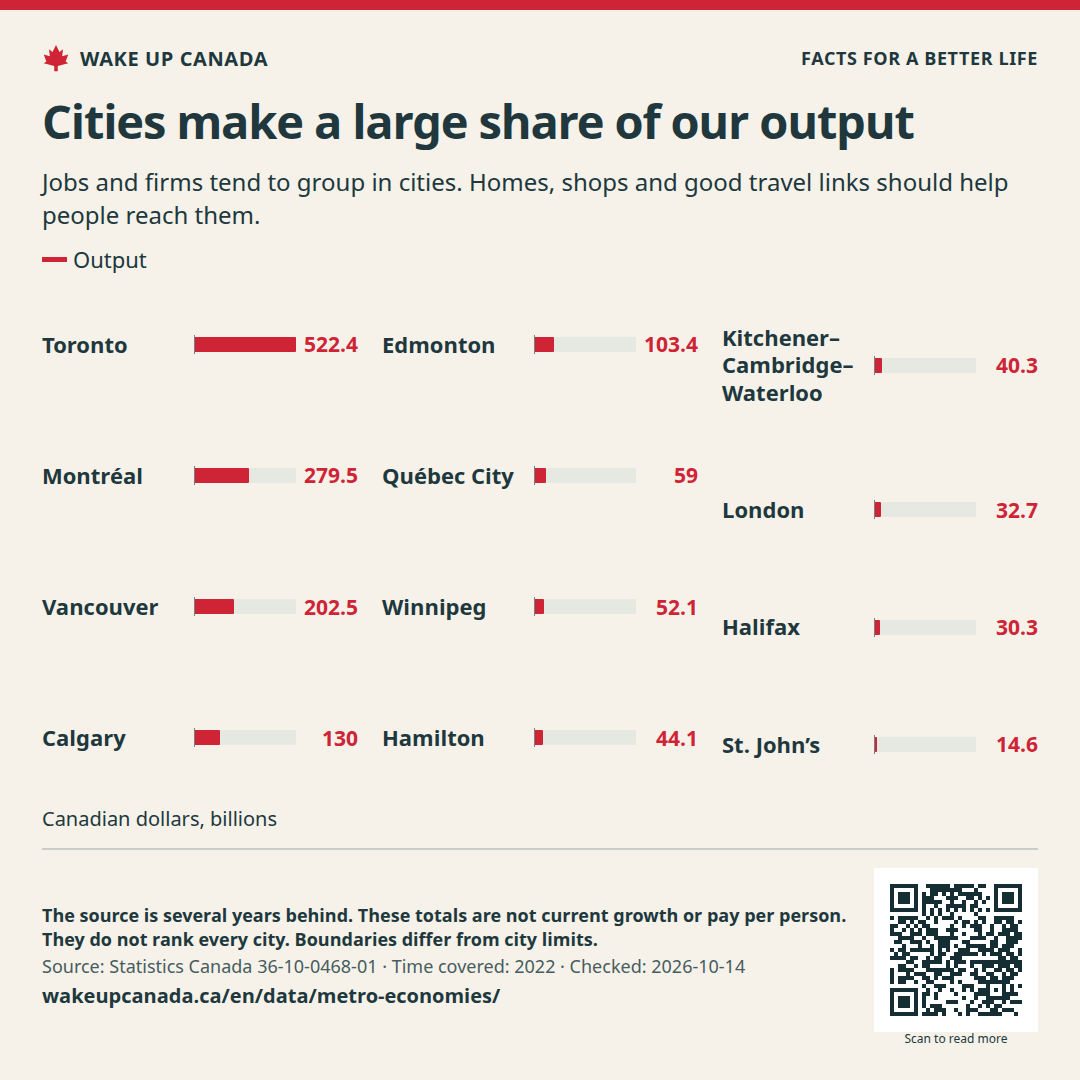
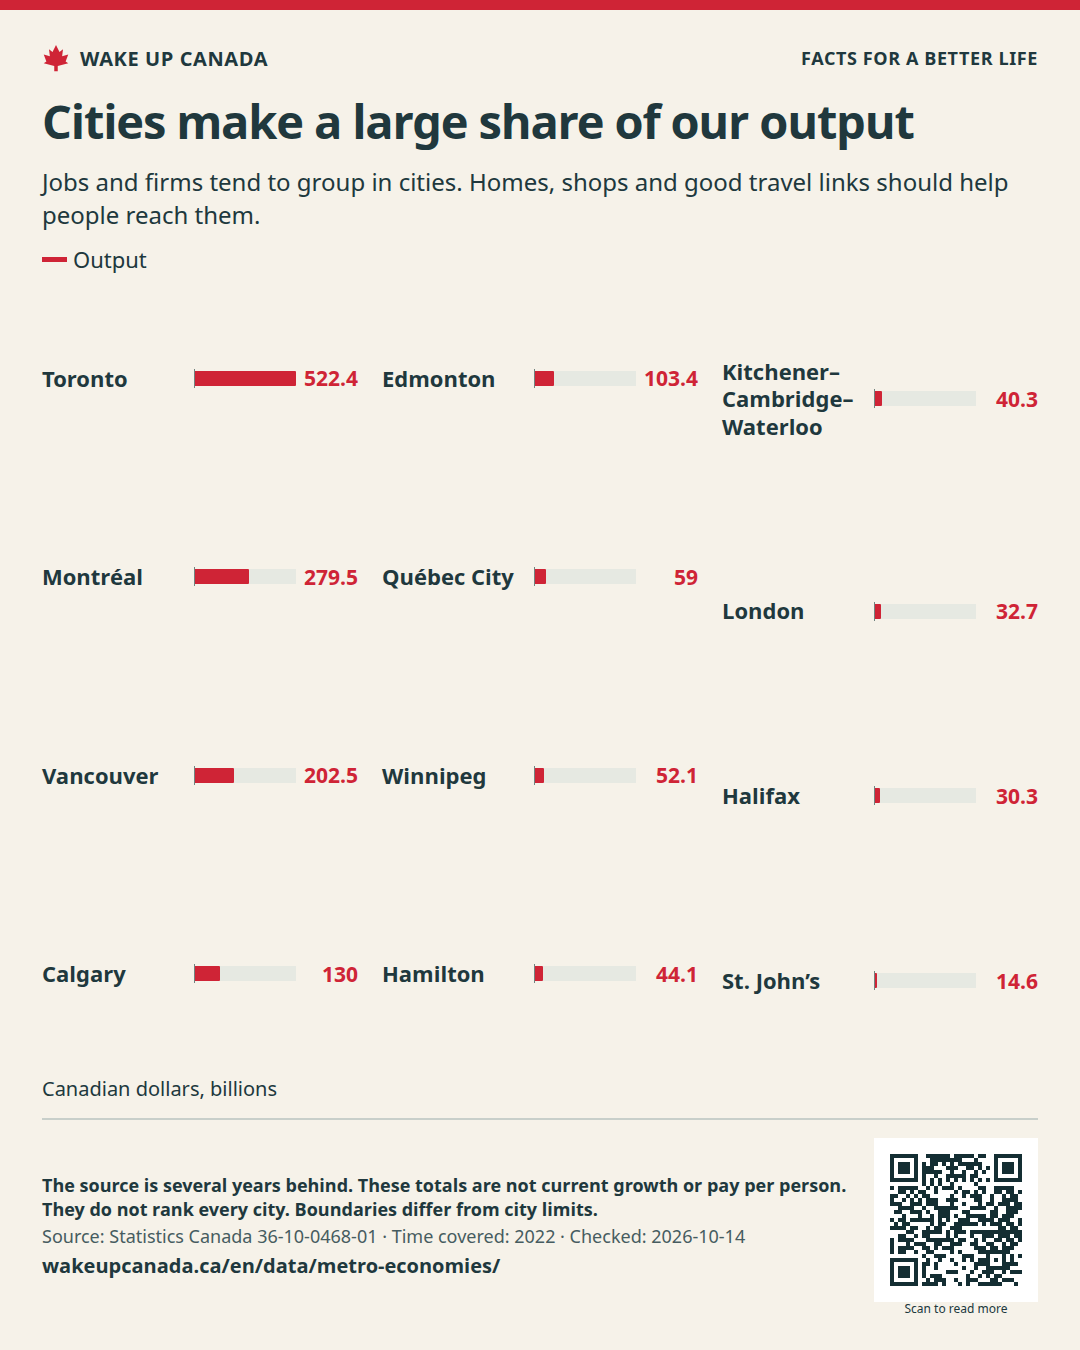
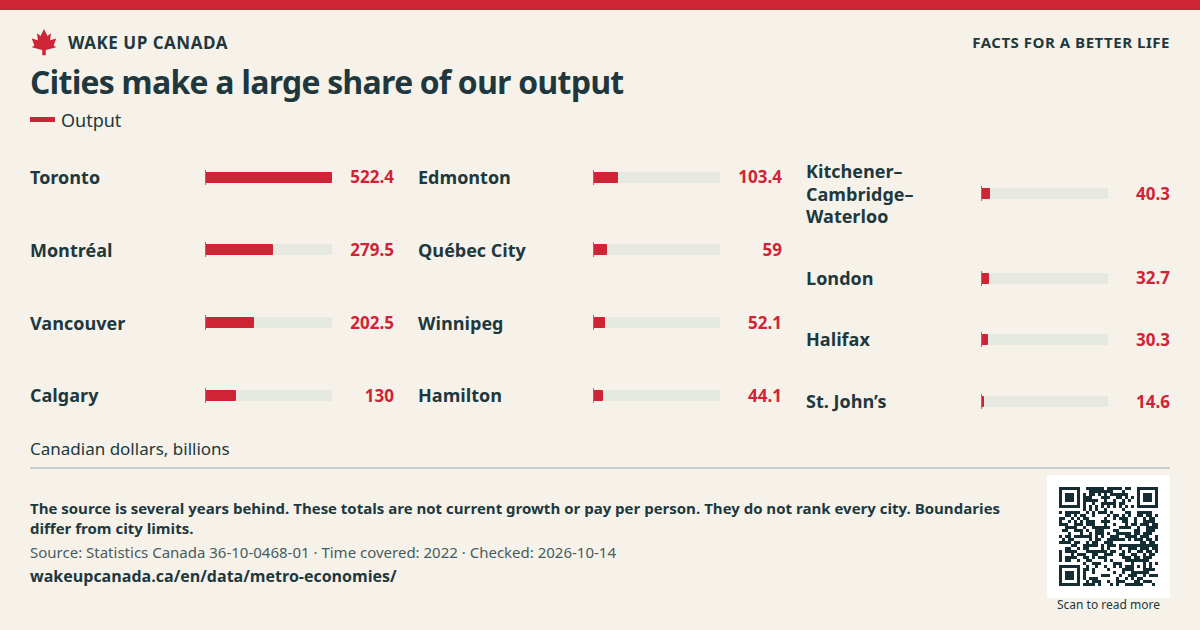
Jobs and firms tend to group in cities. Homes, shops and good travel links should help people reach them.
Time covered: 2022
Canadian dollars, billions
Bars show GDP for twelve named metro areas in the latest shared year of the source table.
Checked:
This table has the same values as the chart. You can scroll the table sideways.
| Time | Place | Output |
|---|---|---|
| 2022 | Toronto | 522.379 |
| 2022 | Montréal | 279.501 |
| 2022 | Vancouver | 202.459 |
| 2022 | Calgary | 129.957 |
| 2022 | Edmonton | 103.384 |
| 2022 | Québec City | 59.042 |
| 2022 | Winnipeg | 52.09 |
| 2022 | Hamilton | 44.093 |
| 2022 | Kitchener–Cambridge–Waterloo | 40.274 |
| 2022 | London | 32.67 |
| 2022 | Halifax | 30.305 |
| 2022 | St. John’s | 14.573 |
When people cannot find a home near good work, they lose time and choices. Total city output is one part of that story.
Allow more homes and shops near jobs. Make daily trips safe, easy and short.
Source released:
WAKE UP CANADA
Help more people see the facts and the plan.
Jobs and firms tend to group in cities. Homes, shops and good travel links should help people reach them.
Keep the source, date and notes with the image.
Checked:
What this does not show: The source is several years behind. These totals are not current growth or pay per person. They do not rank every city. Boundaries differ from city limits.
No account needed. Sharing does not sign you up for email.

If the image opens in a new tab, press and hold it or use your browser’s save tool.