Why this matters
A large economy is not proof of a good life. People also need fair pay, homes they can afford and time to enjoy life.
What we want to change
Let goods, skills and ideas move across Canada. Make room for homes and places to work.
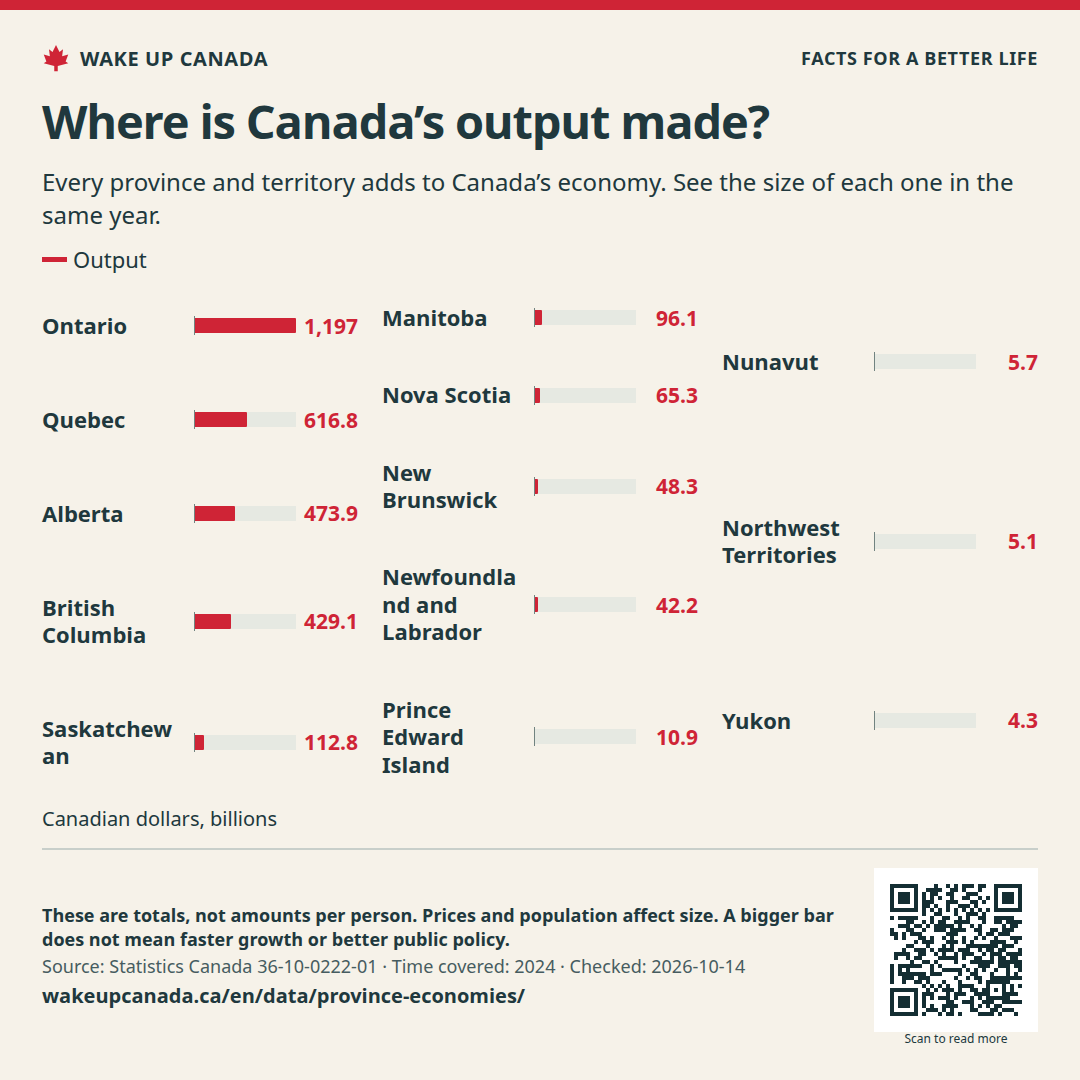
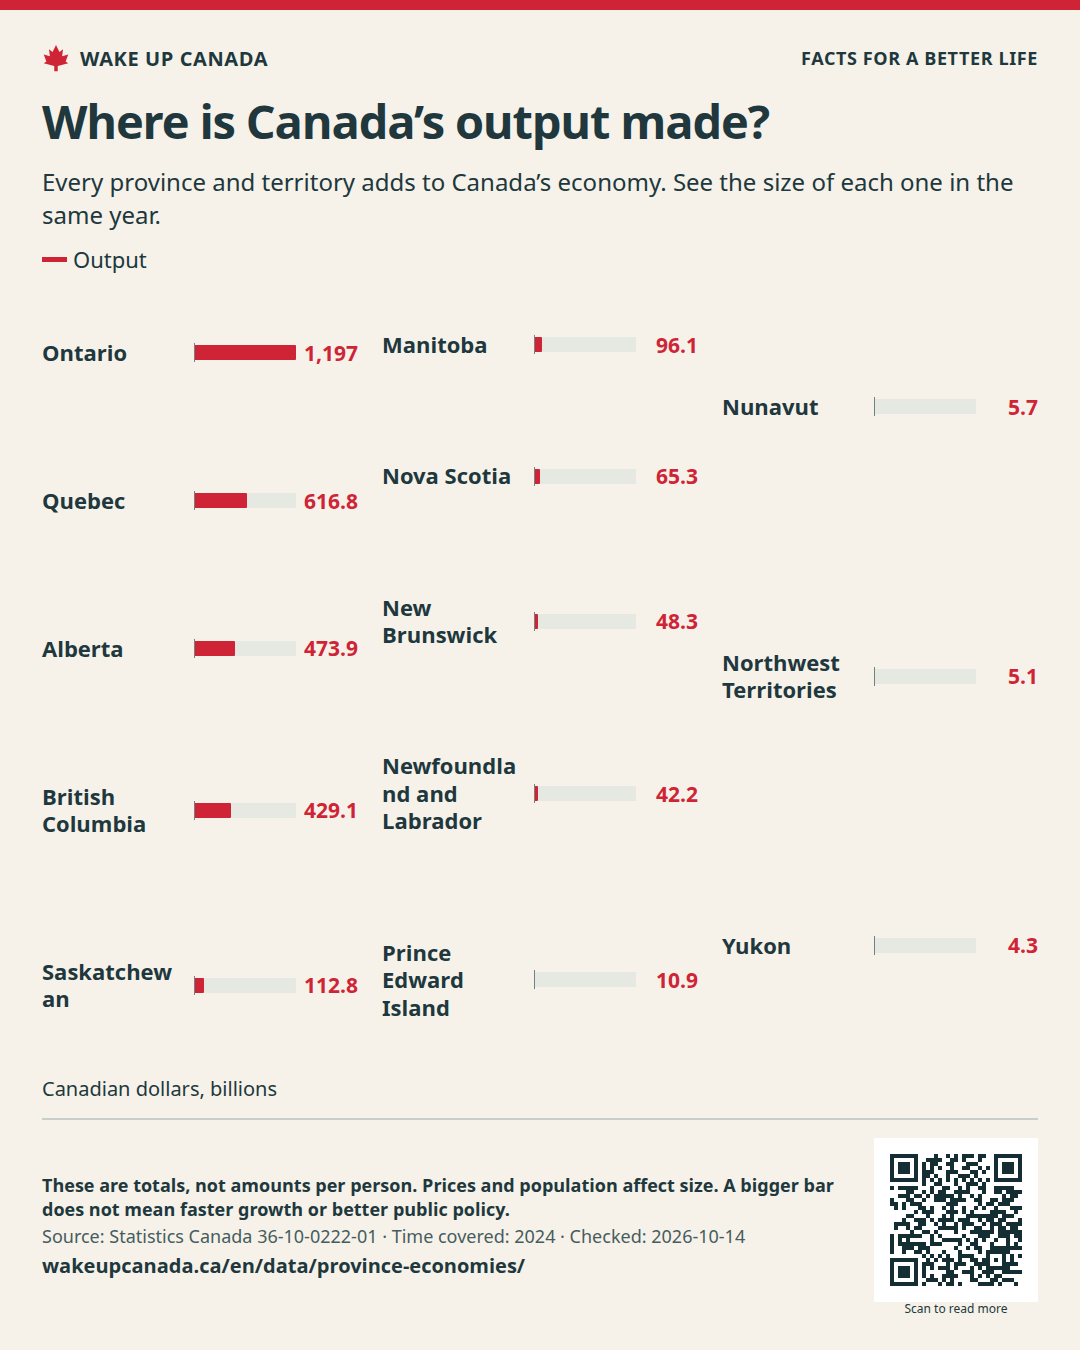
Every province and territory adds to Canada’s economy. See the size of each one in the same year.
Time covered: 2024
Canadian dollars, billions
Bars compare total GDP for all ten provinces and three territories in current dollars.
Checked:
This table has the same values as the chart. You can scroll the table sideways.
| Time | Place | Output |
|---|---|---|
| 2024 | Ontario | 1,197.02 |
| 2024 | Quebec | 616.771 |
| 2024 | Alberta | 473.937 |
| 2024 | British Columbia | 429.089 |
| 2024 | Saskatchewan | 112.839 |
| 2024 | Manitoba | 96.125 |
| 2024 | Nova Scotia | 65.338 |
| 2024 | New Brunswick | 48.302 |
| 2024 | Newfoundland and Labrador | 42.219 |
| 2024 | Prince Edward Island | 10.889 |
| 2024 | Nunavut | 5.668 |
| 2024 | Northwest Territories | 5.123 |
| 2024 | Yukon | 4.349 |
A large economy is not proof of a good life. People also need fair pay, homes they can afford and time to enjoy life.
Let goods, skills and ideas move across Canada. Make room for homes and places to work.
Source released:
WAKE UP CANADA
Help more people see the facts and the plan.
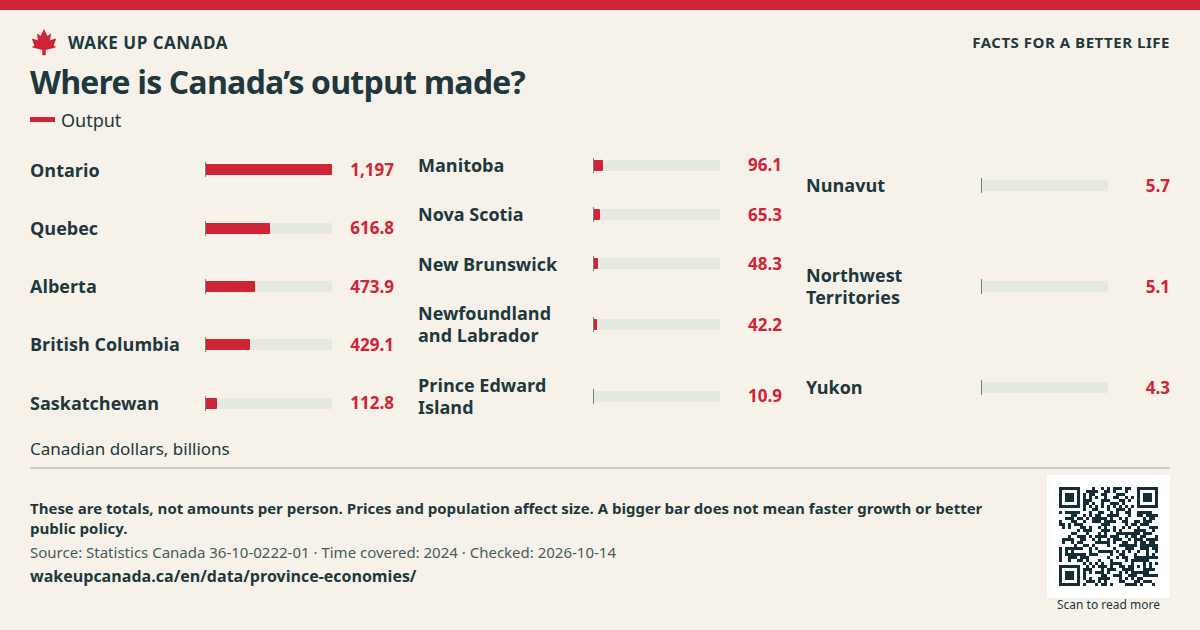
Every province and territory adds to Canada’s economy. See the size of each one in the same year.
Keep the source, date and notes with the image.
Checked:
What this does not show: These are totals, not amounts per person. Prices and population affect size. A bigger bar does not mean faster growth or better public policy.
No account needed. Sharing does not sign you up for email.

If the image opens in a new tab, press and hold it or use your browser’s save tool.