Why this matters
We want lower taxes and better value from public money. Each level of government should show where the money goes.
What we want to change
Show what can cost less and which taxes can fall. Put a clear price on each plan.
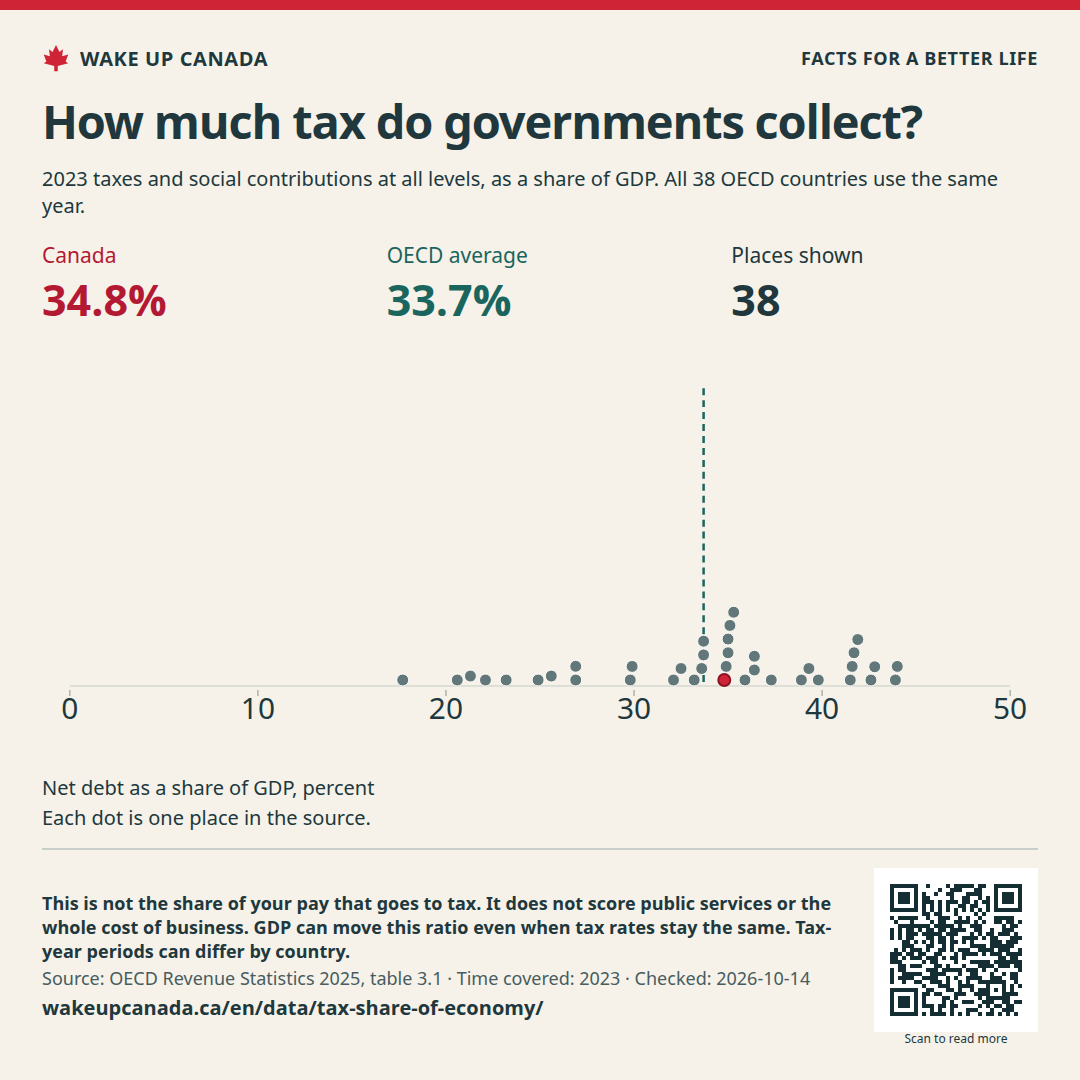
In 2023, Canada’s taxes were worth 34.8% of GDP. The OECD average was 33.7%. This view uses the same year for all 38 countries.
Time covered: 2023
Net debt as a share of GDP, percent
Shown from low to high · Net debt as a share of GDP, percent
This table has the same values as the chart. You can scroll the table sideways.
| Place | Name in the source | Time | Rate |
|---|---|---|---|
| Mexico | Mexico | 2023 | 17.7 |
| Chile | Chile | 2023 | 20.6 |
| Ireland | Ireland | 2023 | 21.3 |
| Colombia | Colombia | 2023 | 22.1 |
| Türkiye | Türkiye | 2023 | 23.2 |
| Costa Rica | Costa Rica | 2023 | 24.9 |
| United States | United States | 2023 | 25.6 |
| Switzerland | Switzerland | 2023 | 26.9 |
| South Korea | Korea | 2023 | 26.9 |
| Israel | Israel | 2023 | 29.8 |
| Australia | Australia | 2023 | 29.9 |
| Lithuania | Lithuania | 2023 | 32.1 |
| Latvia | Latvia | 2023 | 32.5 |
| Czechia | Czechia | 2023 | 33.2 |
| Estonia | Estonia | 2023 | 33.6 |
| Japan | Japan | 2023 | 33.7 |
| New Zealand | New Zealand | 2023 | 33.7 |
| Canada | Canada | 2023 | 34.8 |
| Poland | Poland | 2023 | 34.9 |
| United Kingdom | United Kingdom | 2023 | 35 |
| Hungary | Hungary | 2023 | 35 |
| Slovakia | Slovak Republic | 2023 | 35.1 |
| Portugal | Portugal | 2023 | 35.3 |
| Iceland | Iceland | 2023 | 35.9 |
| Spain | Spain | 2023 | 36.4 |
| Slovenia | Slovenia | 2023 | 36.4 |
| Germany | Germany | 2023 | 37.3 |
| Greece | Greece | 2023 | 38.9 |
| Netherlands | Netherlands | 2023 | 39.3 |
| Luxembourg | Luxembourg | 2023 | 39.8 |
| Italy | Italy | 2023 | 41.5 |
| Norway | Norway | 2023 | 41.6 |
| Sweden | Sweden | 2023 | 41.7 |
| Belgium | Belgium | 2023 | 41.9 |
| Austria | Austria | 2023 | 42.6 |
| Finland | Finland | 2023 | 42.8 |
| France | France | 2023 | 43.9 |
| Denmark | Denmark | 2023 | 44 |
| OECD average | OECD Average | 2023 | 33.7 |
All 38 OECD countries in 2023, with Canada and the OECD average marked.
Checked:
We want lower taxes and better value from public money. Each level of government should show where the money goes.
Show what can cost less and which taxes can fall. Put a clear price on each plan.
Source released:
WAKE UP CANADA
Help more people see the facts and the plan.
In 2023, Canada’s taxes were worth 34.8% of GDP. The OECD average was 33.7%. This view uses the same year for all 38 countries.
Keep the source, date and notes with the image.
Checked:
What this does not show: This is not the share of your pay that goes to tax. It does not score public services or the whole cost of business. GDP can move this ratio even when tax rates stay the same. Tax-year periods can differ by country.
No account needed. Sharing does not sign you up for email.

If the image opens in a new tab, press and hold it or use your browser’s save tool.