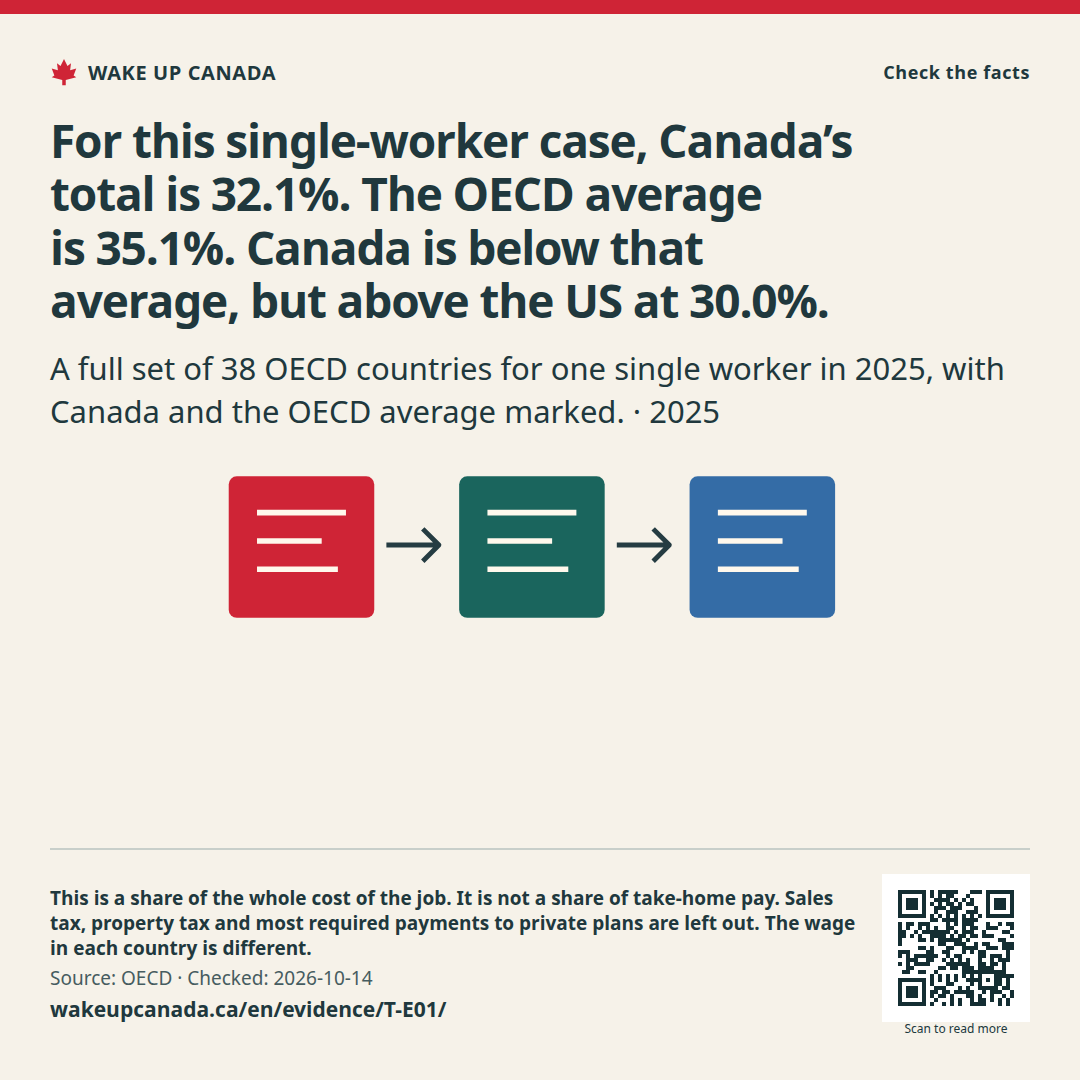
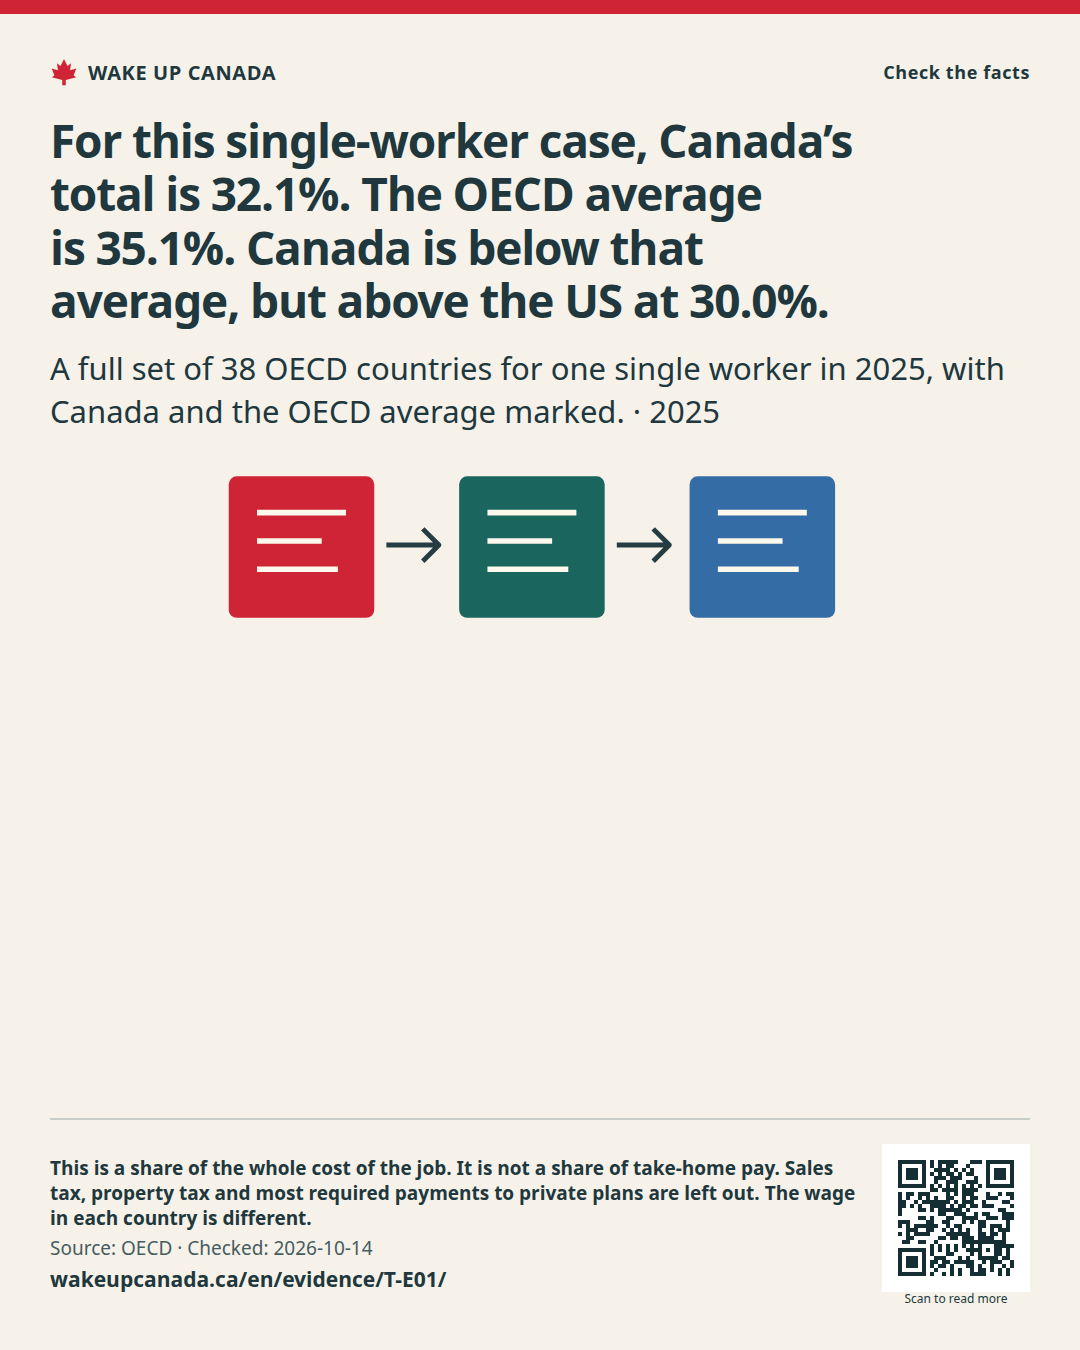
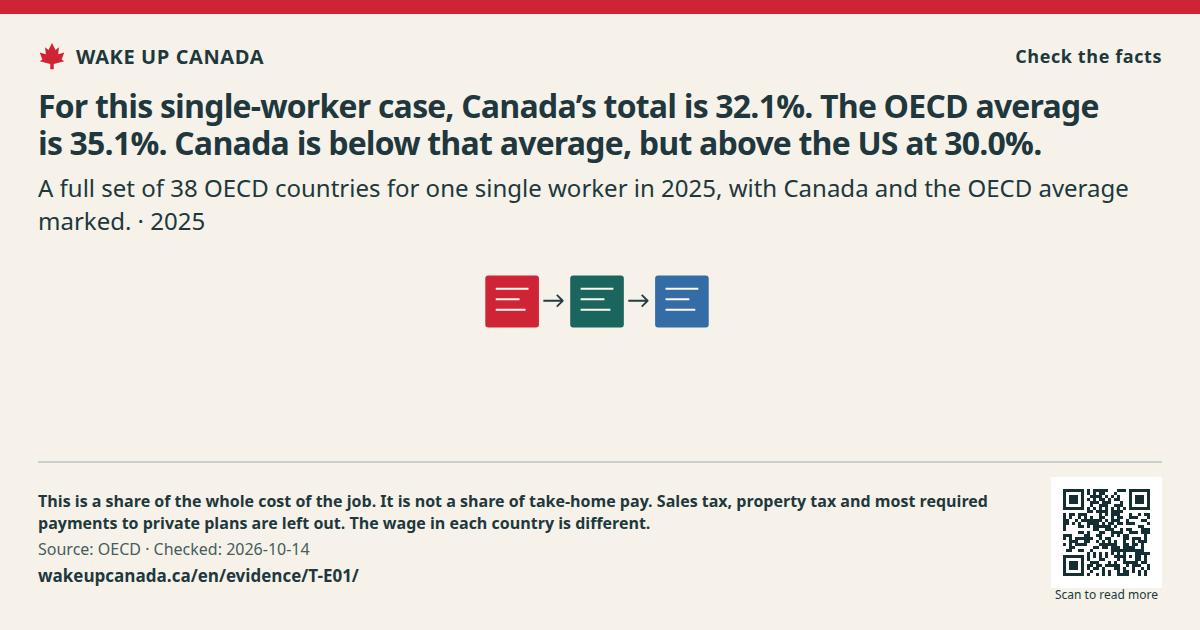
For this single-worker case, Canada’s total is 32.1%. The OECD average is 35.1%. Canada is below that average, but above the US at 30.0%.

Checked 2026-10-14. Each record says what the source can and cannot show.

What this covers

Place: A full set of 38 OECD countries for one single worker in 2025, with Canada and the OECD average marked.
Time covered: 2025

What this does not prove

This is a share of the whole cost of the job. It is not a share of take-home pay. Sales tax, property tax and most required payments to private plans are left out. The wage in each country is different.

Read the source

OECD: Taxing Wages 2026 ↗

OECD · 2026-04-22

Where to look: OECD: Taxing Wages 2026

Fixes and updates

No fact has changed in this version. If we fix a claim, we will add the date and explain the change here and in our list of fixes.
Sources & fixes →

WAKE UP CANADA

Share the case for change

Help more people see the facts and the plan.

For this single-worker case, Canada’s total is 32.1%. The OECD average is 35.1%. Canada is below that average, but above the US at 30.0%.

Keep the source, date and notes with the image.

Checked:

What this does not show: This is a share of the whole cost of the job. It is not a share of take-home pay. Sales tax, property tax and most required payments to private plans are left out. The wage in each country is different.

wakeupcanada.ca/en/evidence/T-E01/
Scan to open this page
Scan this code to read the full case.

Save an image

If the image opens in a new tab, press and hold it or use your browser’s save tool.

Sources and notes