The model points to less poverty

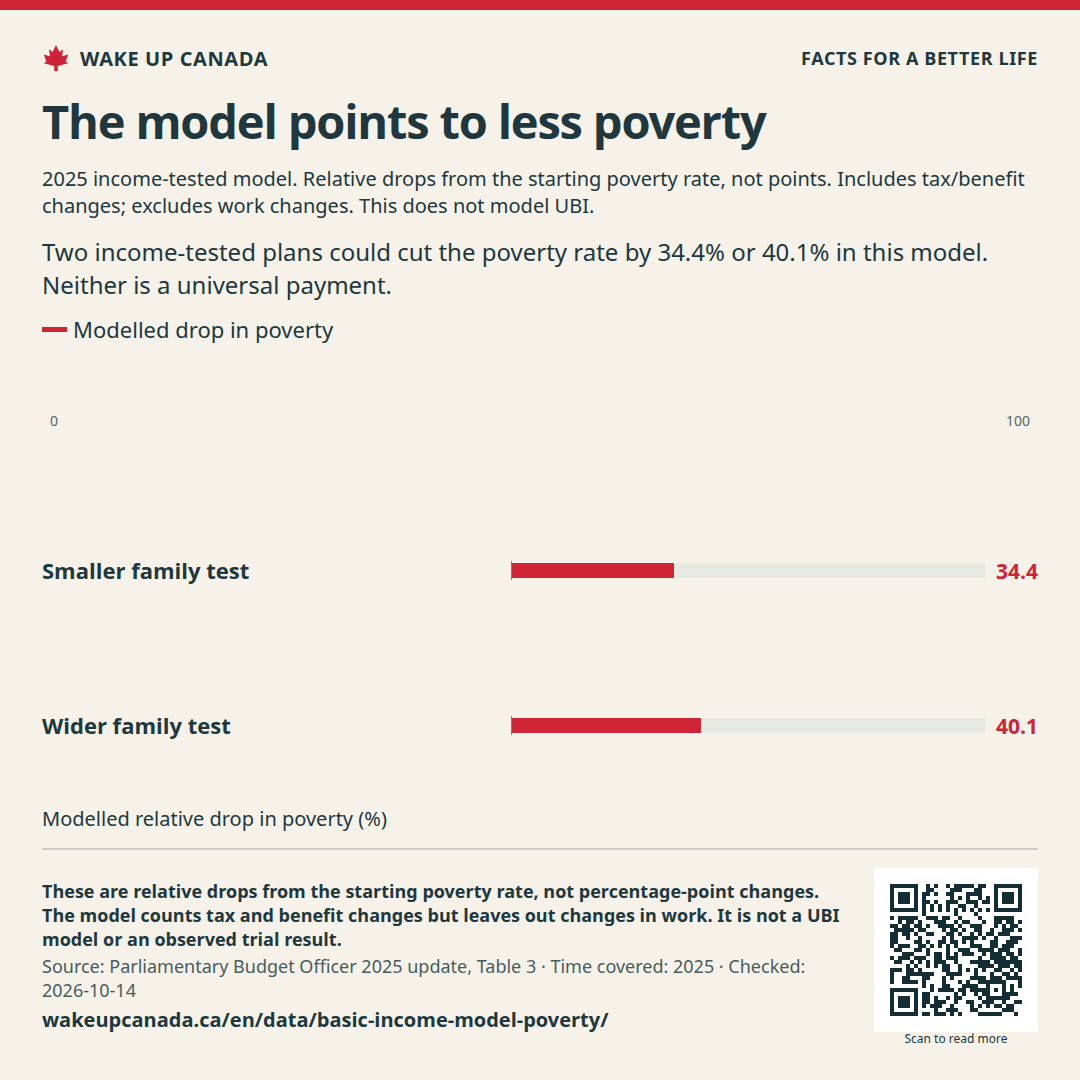
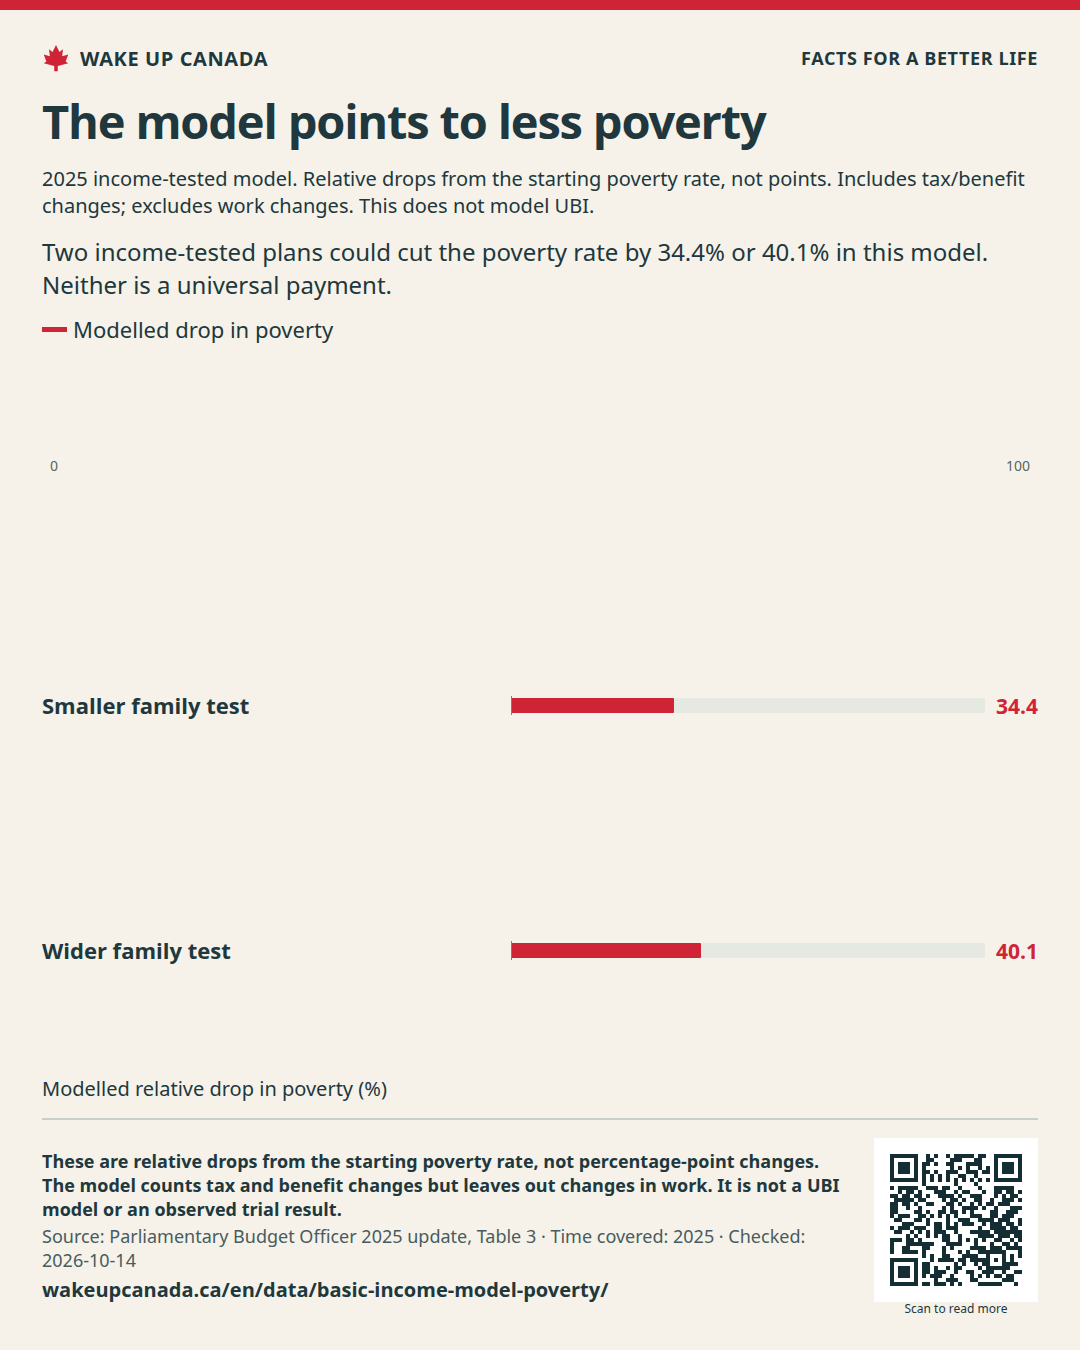
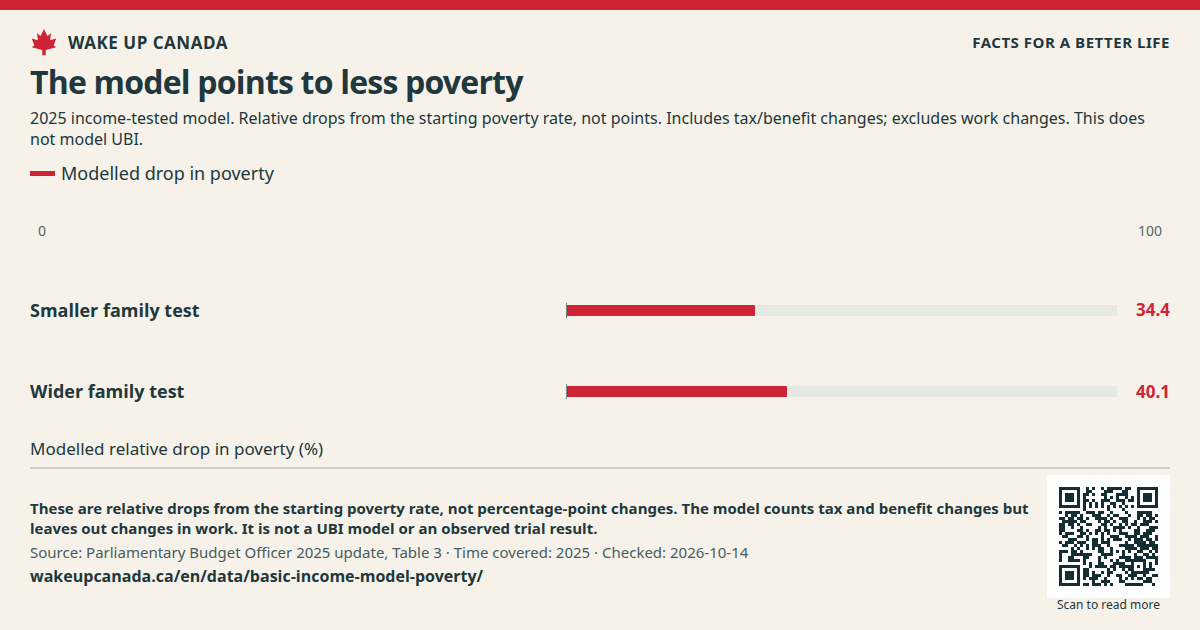
Two income-tested plans could cut the poverty rate by 34.4% or 40.1% in this model. Neither is a universal payment.

Two plans. Two modelled drops in poverty.

Time covered: 2025

0100.0%
  1. Smaller family test34.4%
  2. Wider family test40.1%

Modelled relative drop in poverty (%)

Two bars show relative drops of 34.4% and 40.1% in the poverty rate. These are model results for 2025, not measured trial results.

Dated study · Checked:

See all the data

This table has the same values as the chart. You can scroll the table sideways.

Two plans. Two modelled drops in poverty. · Modelled relative drop in poverty (%)
TimePlaceModelled drop in poverty
2025Smaller family test34.4%
2025Wider family test40.1%
Download the data (CSV) ↓

Why this matters

We want a steady cash floor for all. Models can help us test designs and costs. Real trials help us learn what people face.

What we want to change

Back basic-income pilots across Canada. Publish their full results and a clear plan to pay for lasting support.

Back a plan for change

Sources

  1. Parliamentary Budget Officer · 2025 update, Table 3 ↗

    Source released:

WAKE UP CANADA

Share the case for change

Help more people see the facts and the plan.

The model points to less poverty

Two income-tested plans could cut the poverty rate by 34.4% or 40.1% in this model. Neither is a universal payment.

Keep the source, date and notes with the image.

Checked:

What this does not show: These are relative drops from the starting poverty rate, not percentage-point changes. The model counts tax and benefit changes but leaves out changes in work. It is not a UBI model or an observed trial result.
wakeupcanada.ca/en/data/basic-income-model-poverty/
Scan to open this page
Scan this code to read the full case.

Save an image

If the image opens in a new tab, press and hold it or use your browser’s save tool.

Sources and notes