All data stories / A fair chance
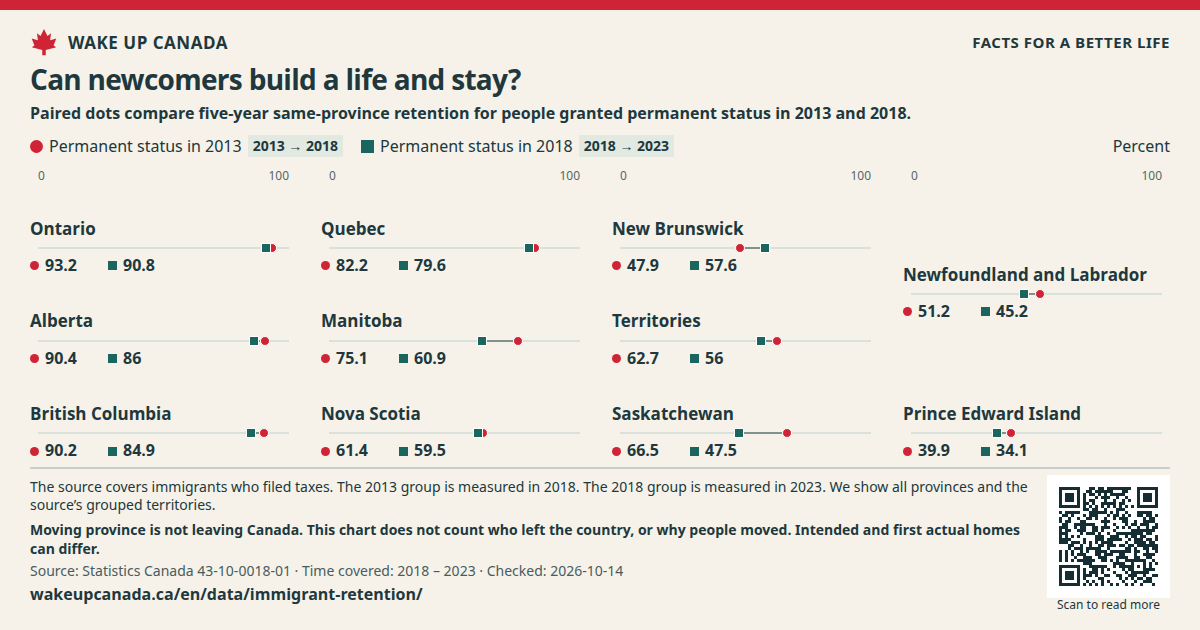
Can newcomers build a life and stay? See who still lived in their planned province five years after getting permanent status. This is one part of a much bigger question.
Can newcomers build a life and stay? Time covered: 2018 — 2023
Permanent status in 2013 · 2018 Permanent status in 2018 · 2023 0 100.0%
Ontario 90.8%
Permanent status in 2013: 93.2% · Permanent status in 2018: 90.8%
Alberta 86.0%
Permanent status in 2013: 90.4% · Permanent status in 2018: 86.0%
British Columbia 84.9%
Permanent status in 2013: 90.2% · Permanent status in 2018: 84.9%
Quebec 79.6%
Permanent status in 2013: 82.2% · Permanent status in 2018: 79.6%
Manitoba 60.9%
Permanent status in 2013: 75.1% · Permanent status in 2018: 60.9%
Nova Scotia 59.5%
Permanent status in 2013: 61.4% · Permanent status in 2018: 59.5%
New Brunswick 57.6%
Permanent status in 2013: 47.9% · Permanent status in 2018: 57.6%
Territories 56.0%
Permanent status in 2013: 62.7% · Permanent status in 2018: 56.0%
Saskatchewan 47.5%
Permanent status in 2013: 66.5% · Permanent status in 2018: 47.5%
Newfoundland and Labrador 45.2%
Permanent status in 2013: 51.2% · Permanent status in 2018: 45.2%
Prince Edward Island 34.1%
Permanent status in 2013: 39.9% · Permanent status in 2018: 34.1%
Percent
Paired dots compare five-year same-province retention for people granted permanent status in 2013 and 2018.
Checked: Oct 14, 2026
See all the data This table has the same values as the chart. You can scroll the table sideways.
Download the data (CSV) ↓ Why this matters Recruiting people is a start. Homes, good work and a sense of belonging help people build a life.
What we want to change Help people rent or buy a home and use their skills. Study why people move, while respecting their freedom to move.
What this does not show Moving province is not leaving Canada. This chart does not count who left the country, or why people moved. Intended and first actual homes can differ.
Read this fairly Moving can be a good choice. Some regions improved. Groups also differ in age, work and family ties, so the chart does not prove a policy caused the gap.
How we made this chart The source covers immigrants who filed taxes. The 2013 group is measured in 2018. The 2018 group is measured in 2023. We show all provinces and the source’s grouped territories.