All data stories / Homes and places
How our city economies have changed Cities bring jobs and firms close together. See the output of each metro area over time, with the age of the data shown clearly.
Metro GDP through time Time covered: 2009 — 2022
Full history Past 10 years
Choose places or groups (6/8) Choose up to 8 lines. The table and CSV keep every series.
The first set is a choice, not a ranking. Missing values are not zero.
Find a place or group St. John's, Newfoundland and LabradorYears in this source: 2009 – 2022 Halifax, Nova ScotiaYears in this source: 2009 – 2022 Moncton, New BrunswickYears in this source: 2009 – 2022 Saint John, New BrunswickYears in this source: 2009 – 2022 Fredericton, New BrunswickYears in this source: 2021 – 2022 Saguenay, QuebecYears in this source: 2009 – 2022 Québec, QuebecYears in this source: 2009 – 2022 Sherbrooke, QuebecYears in this source: 2009 – 2022 Trois-Rivières, QuebecYears in this source: 2009 – 2022 Drummondville, QuebecYears in this source: 2021 – 2022 Montréal, QuebecYears in this source: 2009 – 2022 Ottawa – Gatineau, Ontario/QuebecYears in this source: 2009 – 2022 Kingston, OntarioYears in this source: 2009 – 2022 Belleville, OntarioYears in this source: 2009 – 2022 Peterborough, OntarioYears in this source: 2009 – 2022 Oshawa, OntarioYears in this source: 2009 – 2022 Toronto, OntarioYears in this source: 2009 – 2022 Hamilton, OntarioYears in this source: 2009 – 2022 St. Catharines – Niagara, OntarioYears in this source: 2009 – 2022 Kitchener – Cambridge – Waterloo, OntarioYears in this source: 2009 – 2022 Brantford, OntarioYears in this source: 2009 – 2022 Guelph, OntarioYears in this source: 2009 – 2022 London, OntarioYears in this source: 2009 – 2022 Windsor, OntarioYears in this source: 2009 – 2022 Barrie, OntarioYears in this source: 2009 – 2022 Greater Sudbury, OntarioYears in this source: 2009 – 2022 Thunder Bay, OntarioYears in this source: 2009 – 2022 Winnipeg, ManitobaYears in this source: 2009 – 2022 Regina, SaskatchewanYears in this source: 2009 – 2022 Saskatoon, SaskatchewanYears in this source: 2009 – 2022 Lethbridge, AlbertaYears in this source: 2009 – 2022 Calgary, AlbertaYears in this source: 2009 – 2022 Red Deer, AlbertaYears in this source: 2021 – 2022 Edmonton, AlbertaYears in this source: 2009 – 2022 Kelowna, British ColumbiaYears in this source: 2009 – 2022 Kamloops, British ColumbiaYears in this source: 2021 – 2022 Chilliwack, British ColumbiaYears in this source: 2021 – 2022 Abbotsford – Mission, British ColumbiaYears in this source: 2009 – 2022 Vancouver, British ColumbiaYears in this source: 2009 – 2022 Victoria, British ColumbiaYears in this source: 2009 – 2022 Nanaimo, British ColumbiaYears in this source: 2021 – 2022
Use the starting set Showing: 2009 — 2022
Toronto, Ontario
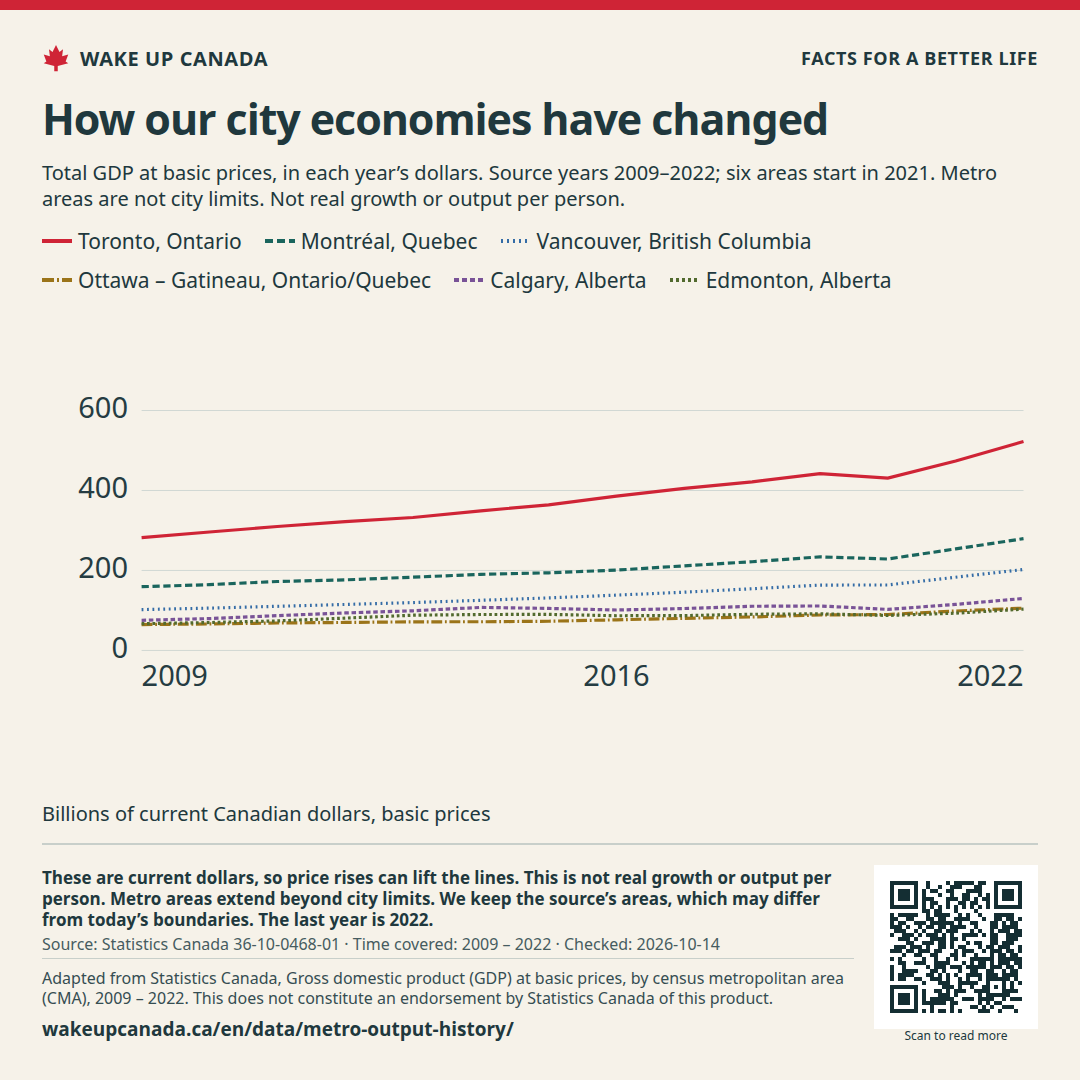
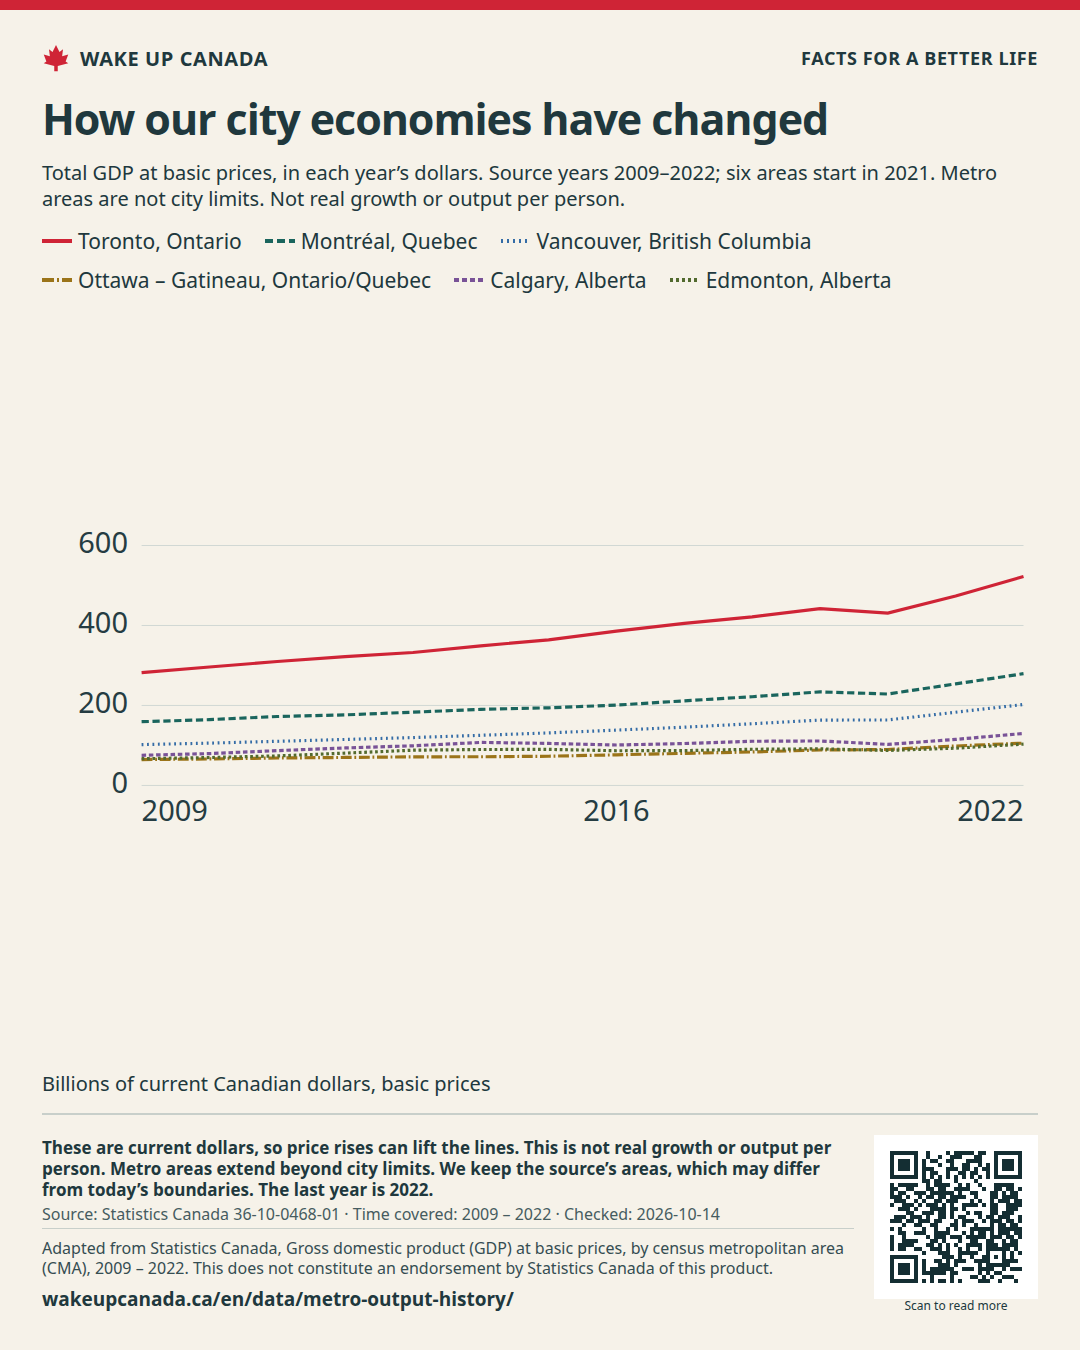
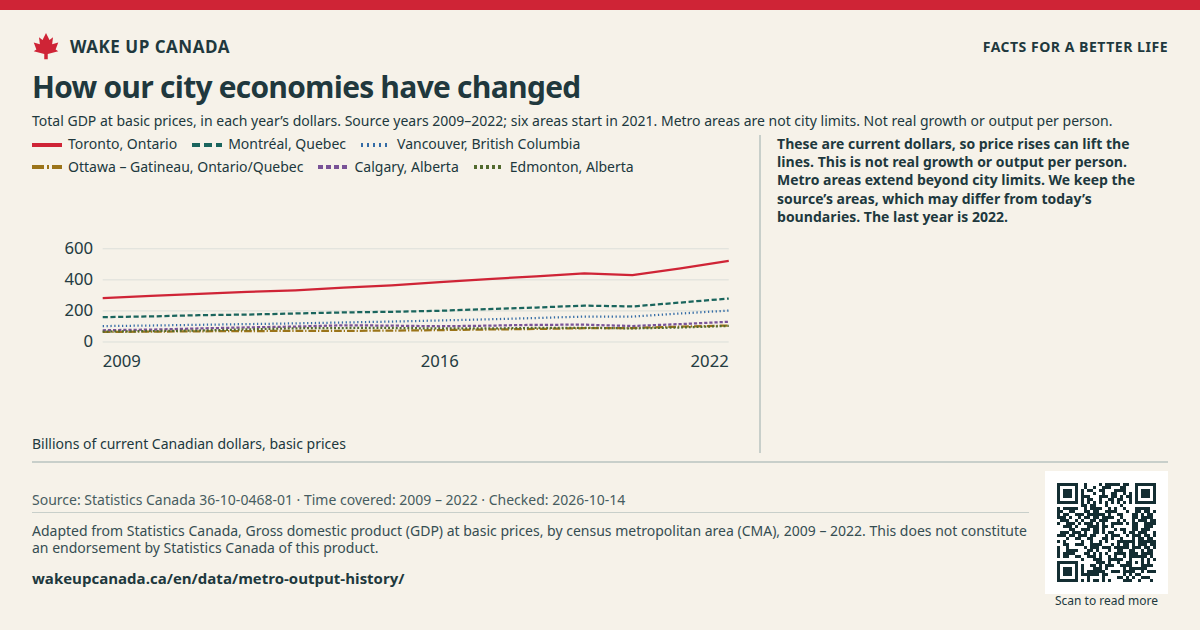
522.4 Last point · 2022 · Billions of current Canadian dollars, basic prices Change over 10 years: +62.2% 2012 → 2022
Montréal, Quebec
279.5 Last point · 2022 · Billions of current Canadian dollars, basic prices Change over 10 years: +58.4% 2012 → 2022
Vancouver, British Columbia
202.5 Last point · 2022 · Billions of current Canadian dollars, basic prices Change over 10 years: +76% 2012 → 2022
Ottawa – Gatineau, Ontario/Quebec
105.8 Last point · 2022 · Billions of current Canadian dollars, basic prices Change over 10 years: +51.1% 2012 → 2022
Calgary, Alberta
130 Last point · 2022 · Billions of current Canadian dollars, basic prices Change over 10 years: +38.5% 2012 → 2022
Edmonton, Alberta
103.4 Last point · 2022 · Billions of current Canadian dollars, basic prices Change over 10 years: +27.8% 2012 → 2022
Toronto, Ontario 522.4 Montréal, Quebec 279.5 Vancouver, British Columbia 202.5 Ottawa – Gatineau, Ontario/Quebec 105.8 Calgary, Alberta 130 Edmonton, Alberta 103.4 600 400 200 0
Billions of current Canadian dollars, basic prices
Lines show total GDP in the chosen metro areas. The full table covers all 41 metro areas in the source. Values use the prices of each year.
Dated release · Checked: Oct 14, 2026
See all the data This table has the same values as the chart. You can scroll the table sideways.
Download the data (CSV) ↓ Why this matters People need homes near good work, shops and schools. City output helps show where work takes place. It does not show who can afford to live there.
What we want to change Allow more homes and shops near jobs. Make walking, cycling and transit safe and useful. Track housing costs beside city output.
What this does not show These are current dollars, so price rises can lift the lines. This is not real growth or output per person. Metro areas extend beyond city limits. We keep the source’s areas, which may differ from today’s boundaries. The last year is 2022.
Read this fairly High city output can go with high rents and long trips. This chart cannot prove that zoning caused a rise or fall in GDP.
How we made this chart We use annual GDP at basic prices from 2009 to 2022. Basic prices leave out taxes on products and add subsidies on them. Ottawa–Gatineau adds the source’s two provincial parts. Six new metro areas enter in 2021.