CANADA AND THE WORLD
How does Canada compare?
See where we gained. See where we fell behind. Use the same years, the same units and the full source.
2015 US dollars per person
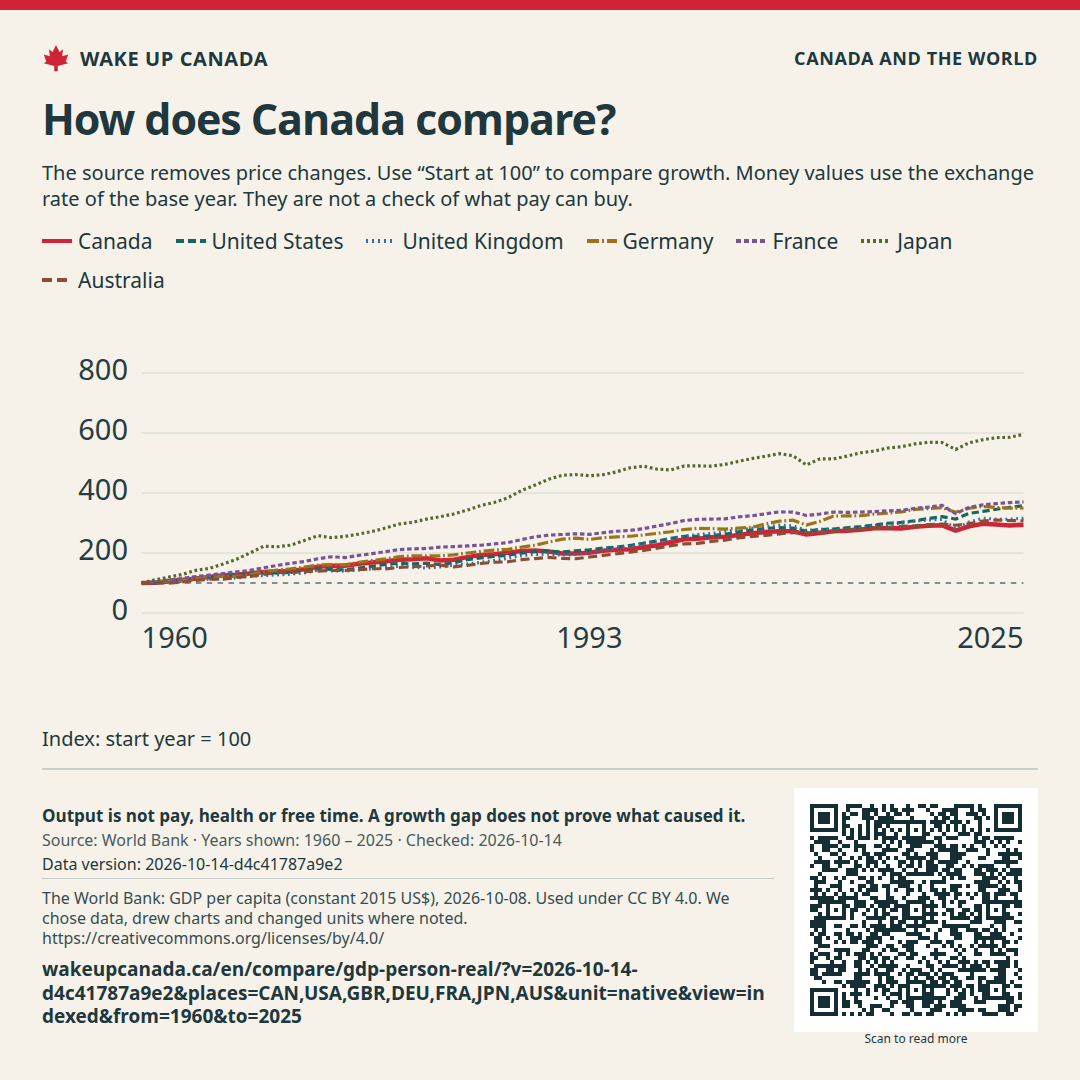
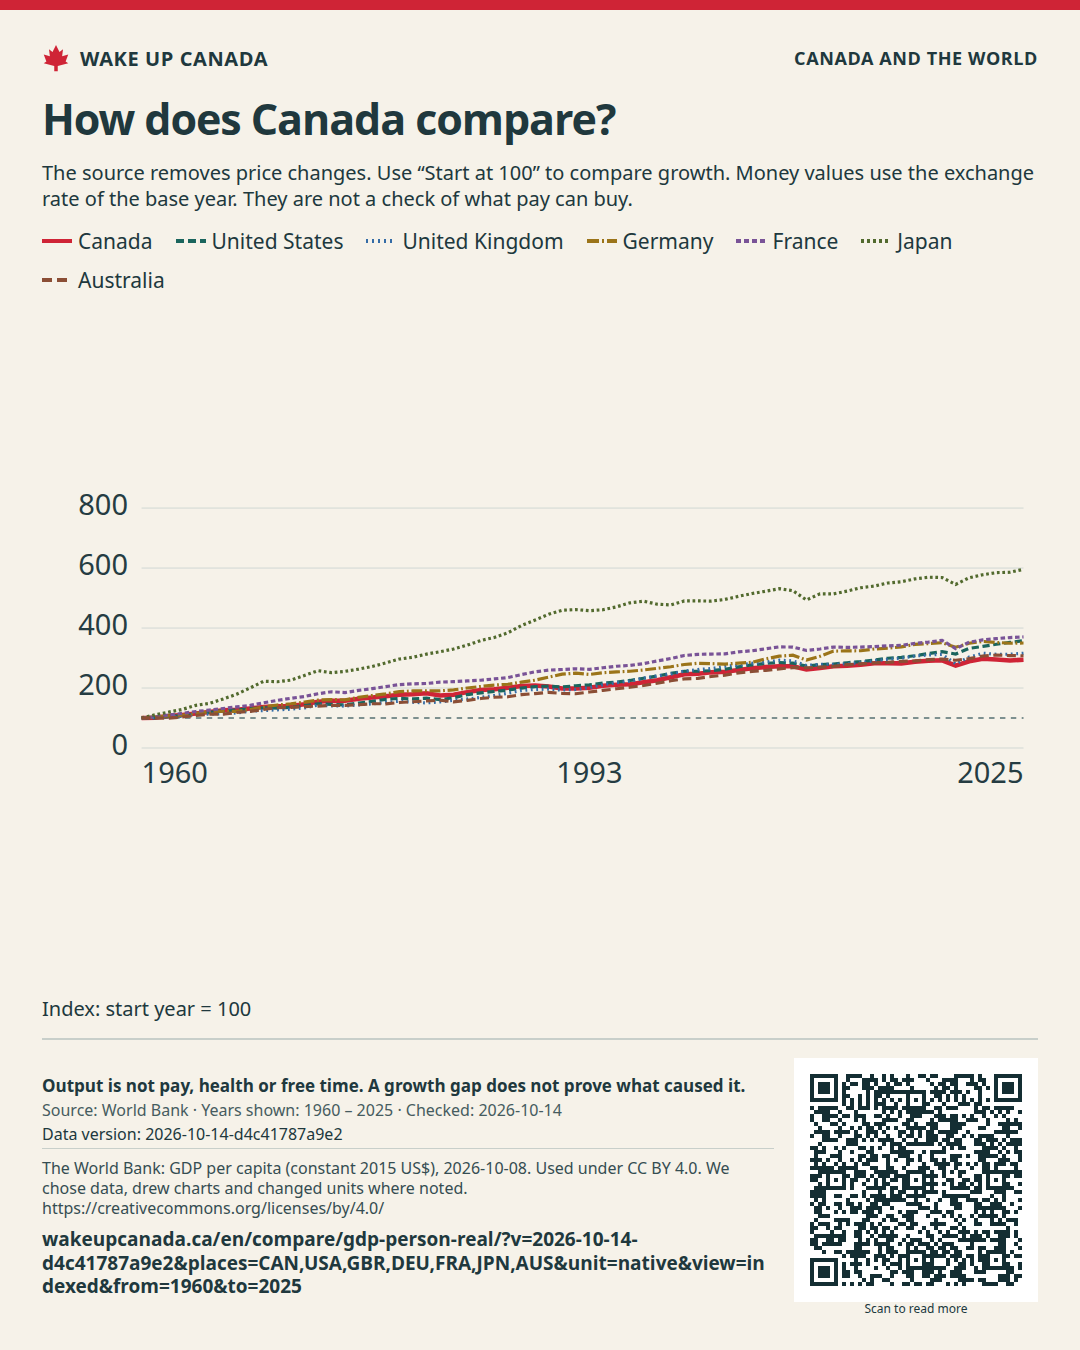
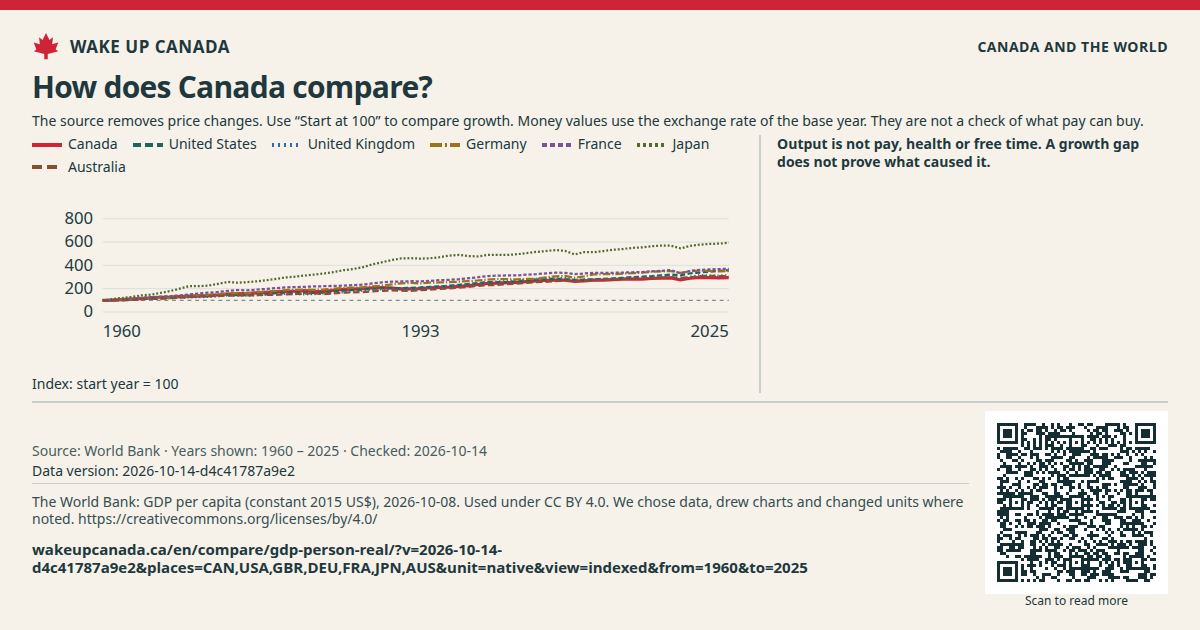
How much did we grow?
Track output per person after price changes. Compare growth over the same years.
US dollars per person
Output in money and metal
See the value of output per person in the unit you choose.
2021 international dollars per person
Output at a common price check
Prices differ from place to place. This view makes a common price check.
People
How many people live here?
Track the number of people in each place. See growth over the same years.
US dollars
Official reserve assets
See the assets kept in reserve by public bodies.
US dollars
The value of listed firms
Compare the market value of firms in the source.
Percent of GDP
Listed firms and the economy
Compare the value of listed firms with yearly output.
Percent of GDP
Public debt
Compare public debt with the size of each economy.
Percent per year
The cost of long-term borrowing
Compare the yield on long-term government bonds.
Display units per one local unit
What a currency buys abroad
See one unit of a place's money in another money or in metal.
US dollars
Public bond sales in world markets
See bond sales by public issuers in the international market.
US dollars
Public bonds paid back
See how much was paid back on public bonds in world markets.
US dollars
Net international bond sales
See new international bond sales after repayments.
Make the case for change
A chart can show a gap. It cannot prove what caused it. Read the evidence, the costs and the change we seek.
Share image How does Canada compare?
WAKE UP CANADA
Share the case for change
How does Canada compare?
Keep the source, date and notes with the image.
Checked:
What this does not show: This release covers OECD and G20 country members. It is not every place in the world.
No account needed. Sharing does not sign you up for email.

Save an image
If the image opens in a new tab, press and hold it or use your browser’s save tool.