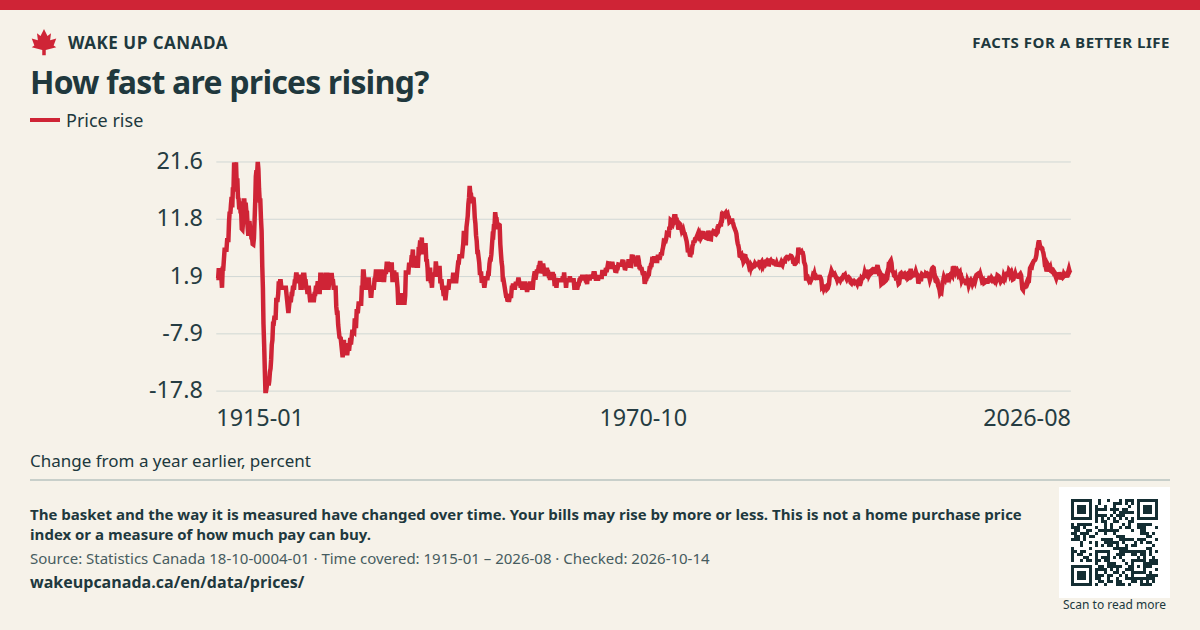
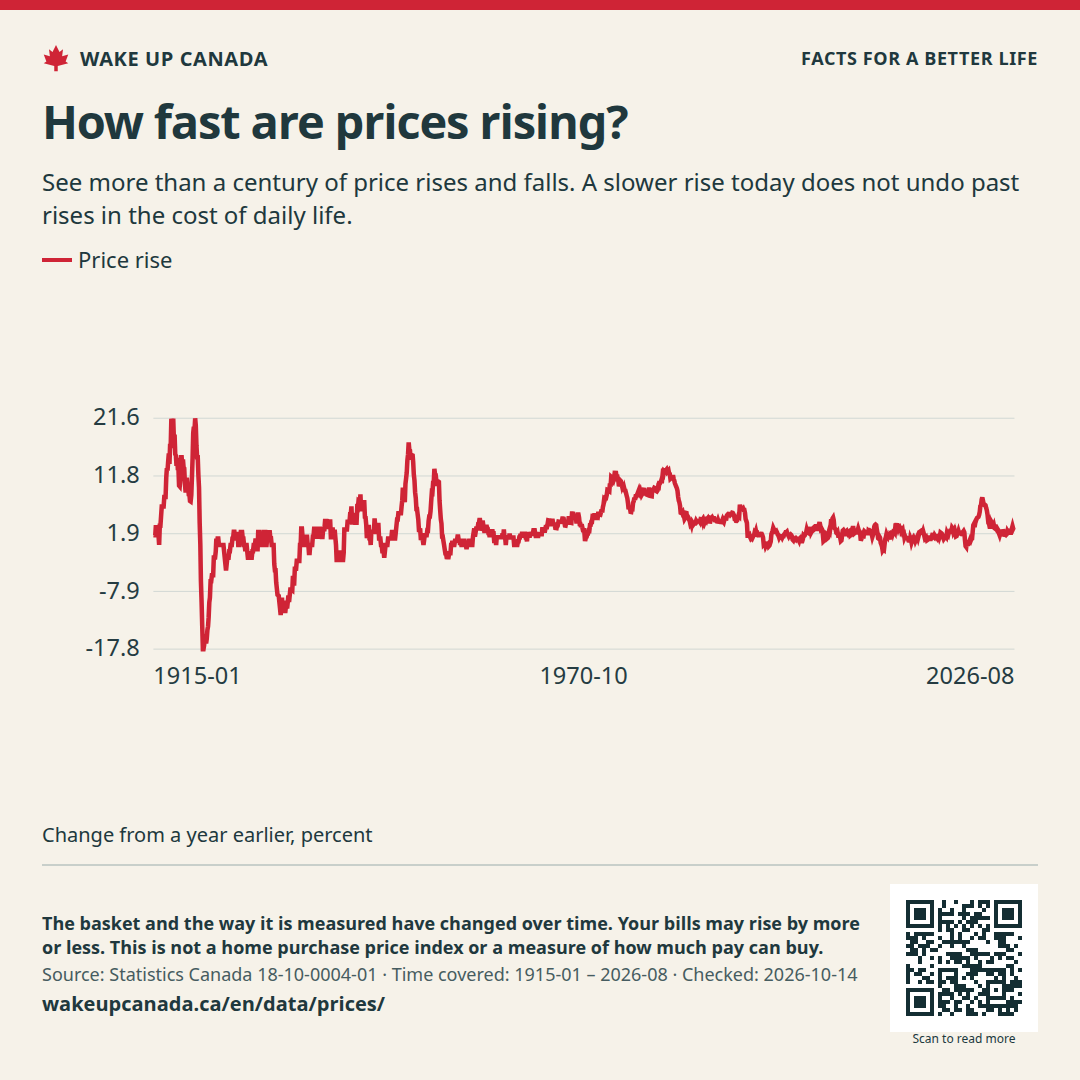
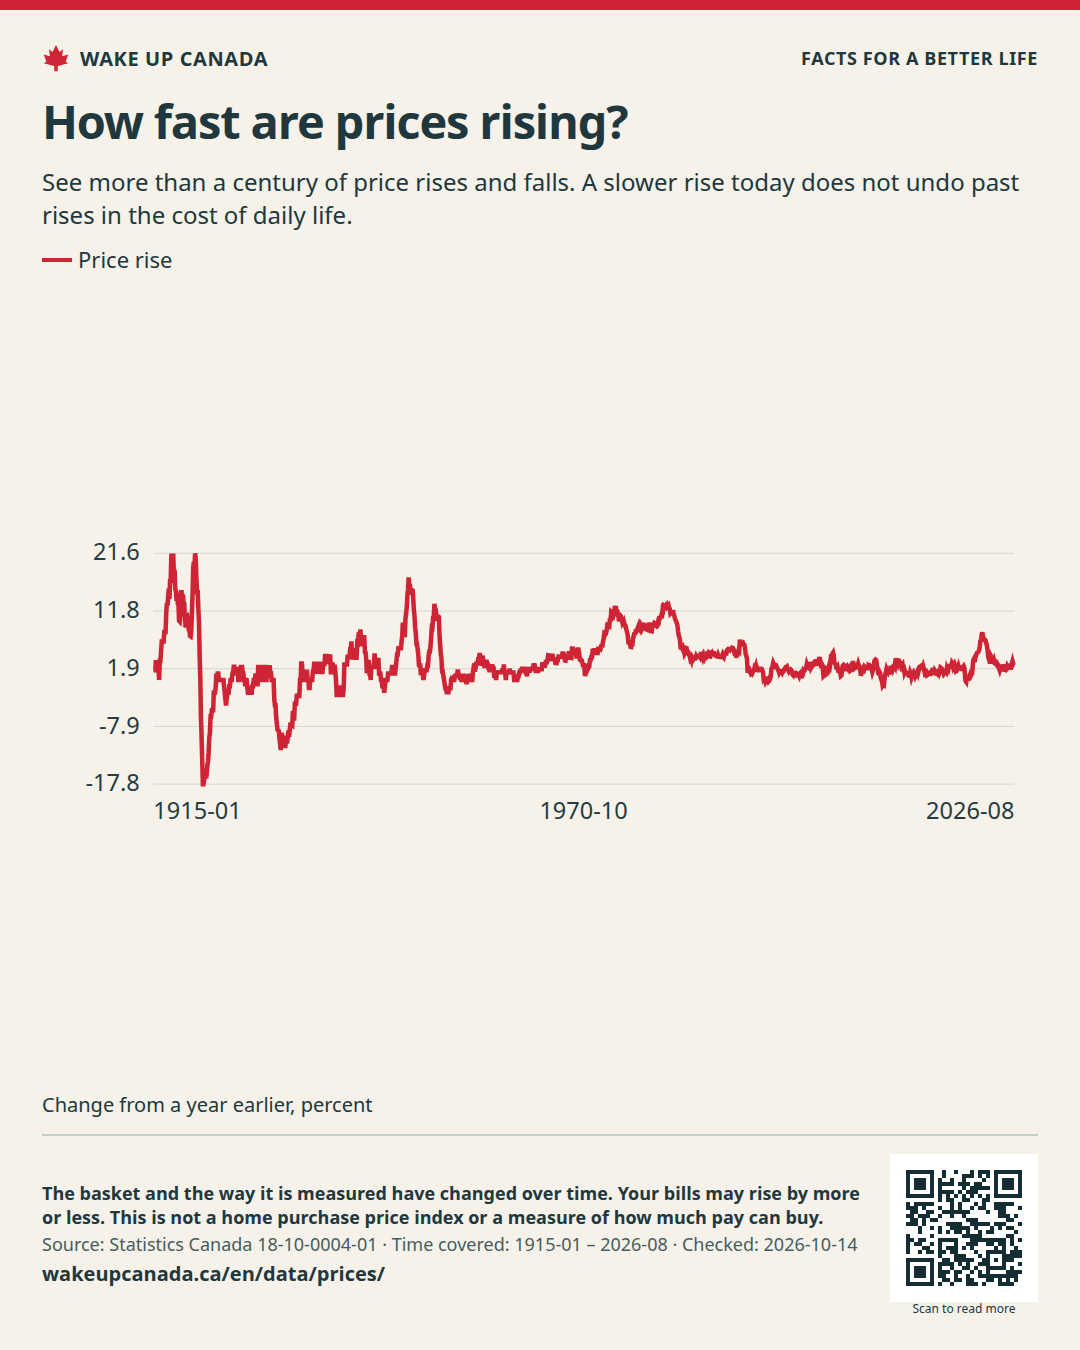
See more than a century of price rises and falls. A slower rise today does not undo past rises in the cost of daily life.
Price changes since 1915
Time covered: Jan 1915 — Aug 2026
Showing: Jan 1915 — Aug 2026
Price rise
3Last point · Change from a year earlier, percent
Price rise 3
24.913.41.9-9.5-21
Jan 1915Aug 2026
Change from a year earlier, percent
The line starts in 1915. It shows how much Canada's all-items price index changed from the same month one year before. Below zero means prices fell on average.
Checked:
See all the data
This table has the same values as the chart. You can scroll the table sideways.
Price changes since 1915 · Change from a year earlier, percent
See more than a century of price rises and falls. A slower rise today does not undo past rises in the cost of daily life.
Keep the source, date and notes with the image.
Checked:
What this does not show: The basket and the way it is measured have changed over time. Your bills may rise by more or less. This is not a home purchase price index or a measure of how much pay can buy.