All data stories / Work and skills
Who do we work for? Public jobs, private jobs and work for yourself all matter. See how each group has changed since 1976.
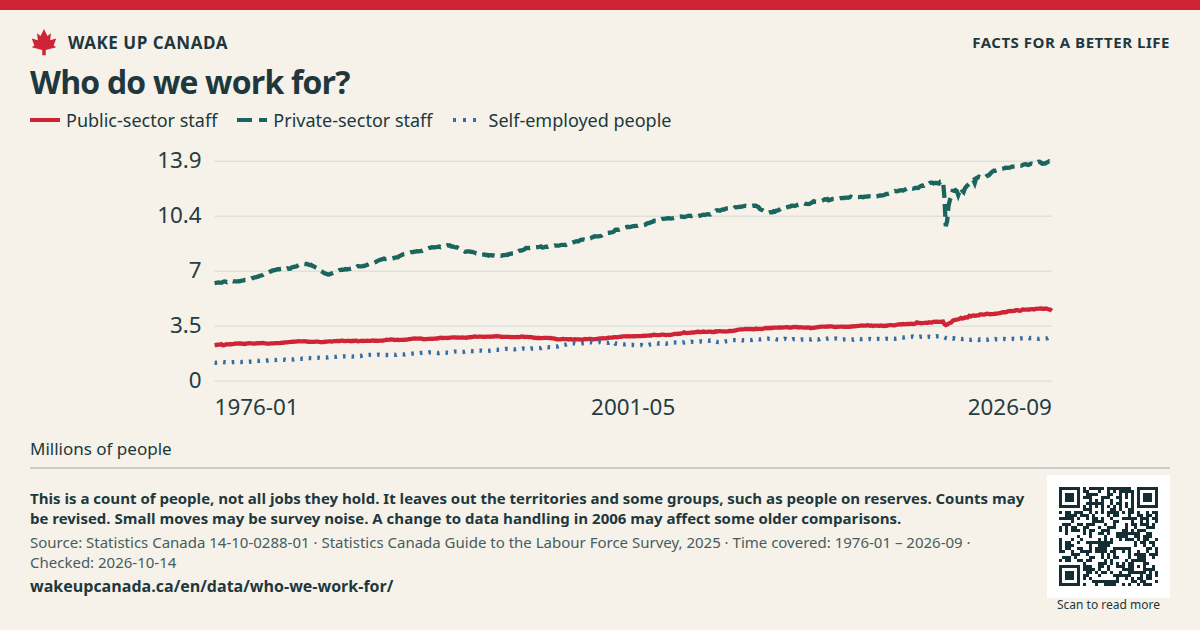
People in work, by type of employer Time covered: Jan 1976 — Sep 2026
Full history Past 20 years Past 10 years
Showing: Jan 1976 — Sep 2026
Public-sector staff
4.448 Last point · Millions of people Change over 10 years: +26.9% Sep 2016 → Sep 2026
Private-sector staff
13.916 Last point · Millions of people Change over 10 years: +17.5% Sep 2016 → Sep 2026
Self-employed people
2.741 Last point · Millions of people Change over 10 years: +2.2% Sep 2016 → Sep 2026
Public-sector staff 4.448 Private-sector staff 13.916 Self-employed people 2.741 15 11.3 7.6 3.8 0.1
Millions of people
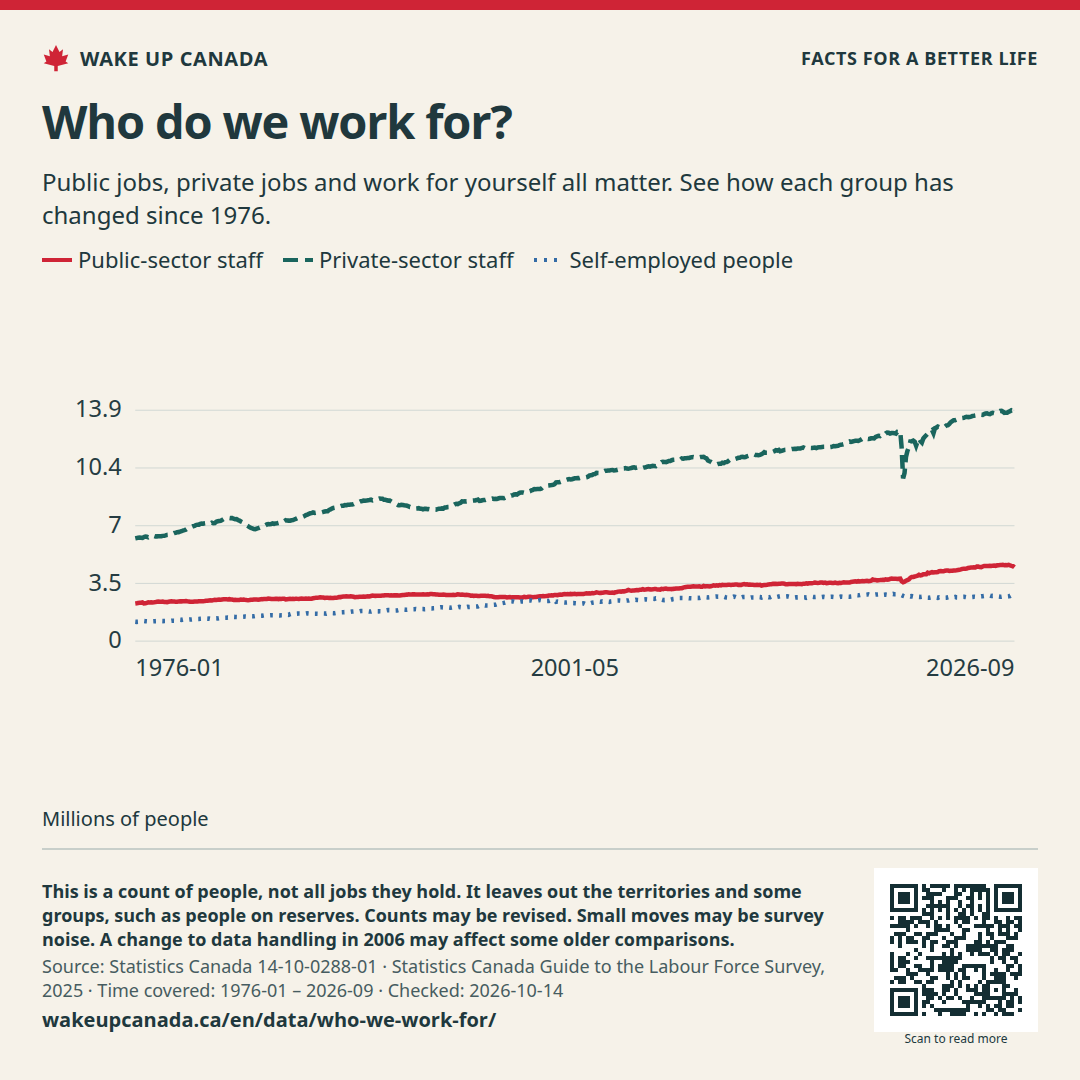
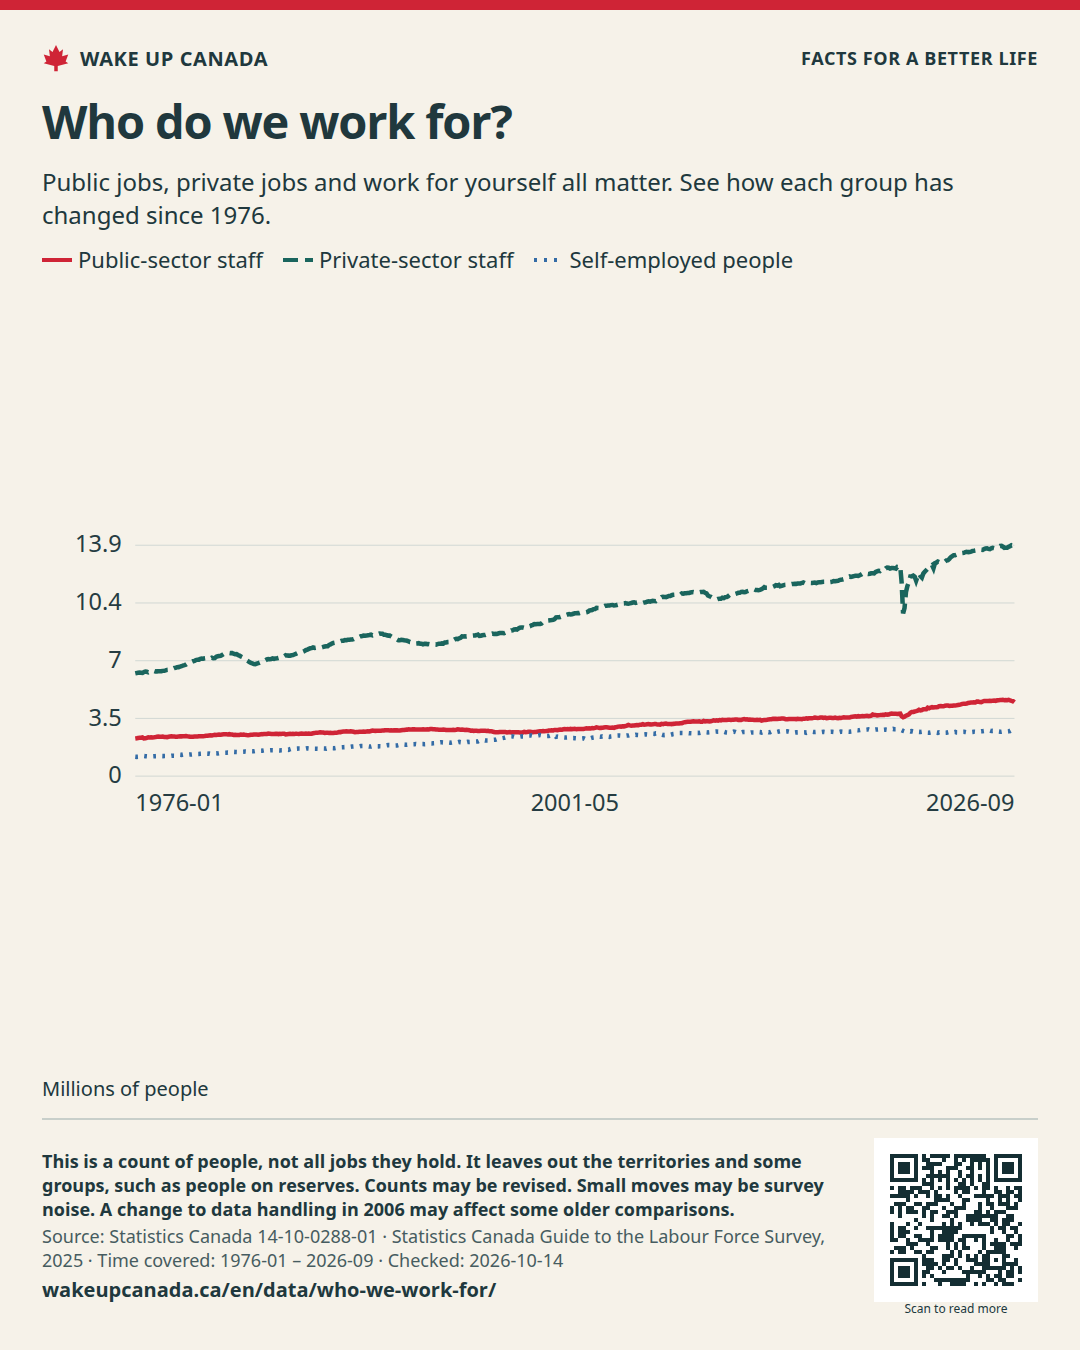
Three lines count public staff, private staff and self-employed people in the ten provinces. The chart starts in 1976.
Checked: Oct 14, 2026
See all the data This table has the same values as the chart. You can scroll the table sideways.
Download the data (CSV) ↓ Why this matters A growing country needs useful firms and good public services. A bigger job count alone does not tell us if pay, care or daily life got better.
What we want to change Make it easier to start a firm and use proven skills. Judge public work by the service it gives people, as well as its cost.
What this does not show This is a count of people, not all jobs they hold. It leaves out the territories and some groups, such as people on reserves. Counts may be revised. Small moves may be survey noise. A change to data handling in 2006 may affect some older comparisons.
Read this fairly Public staff include nurses and teachers. A rise is not proof of waste. Self-employment can mean choice or a lack of other work. This chart does not tell us which.
How we made this chart These are monthly survey counts for age 15 and up. Usual seasonal swings are removed. Each person is counted once, by their main job. Public staff include schools, hospitals and Crown firms. Self-employed people form their own line.