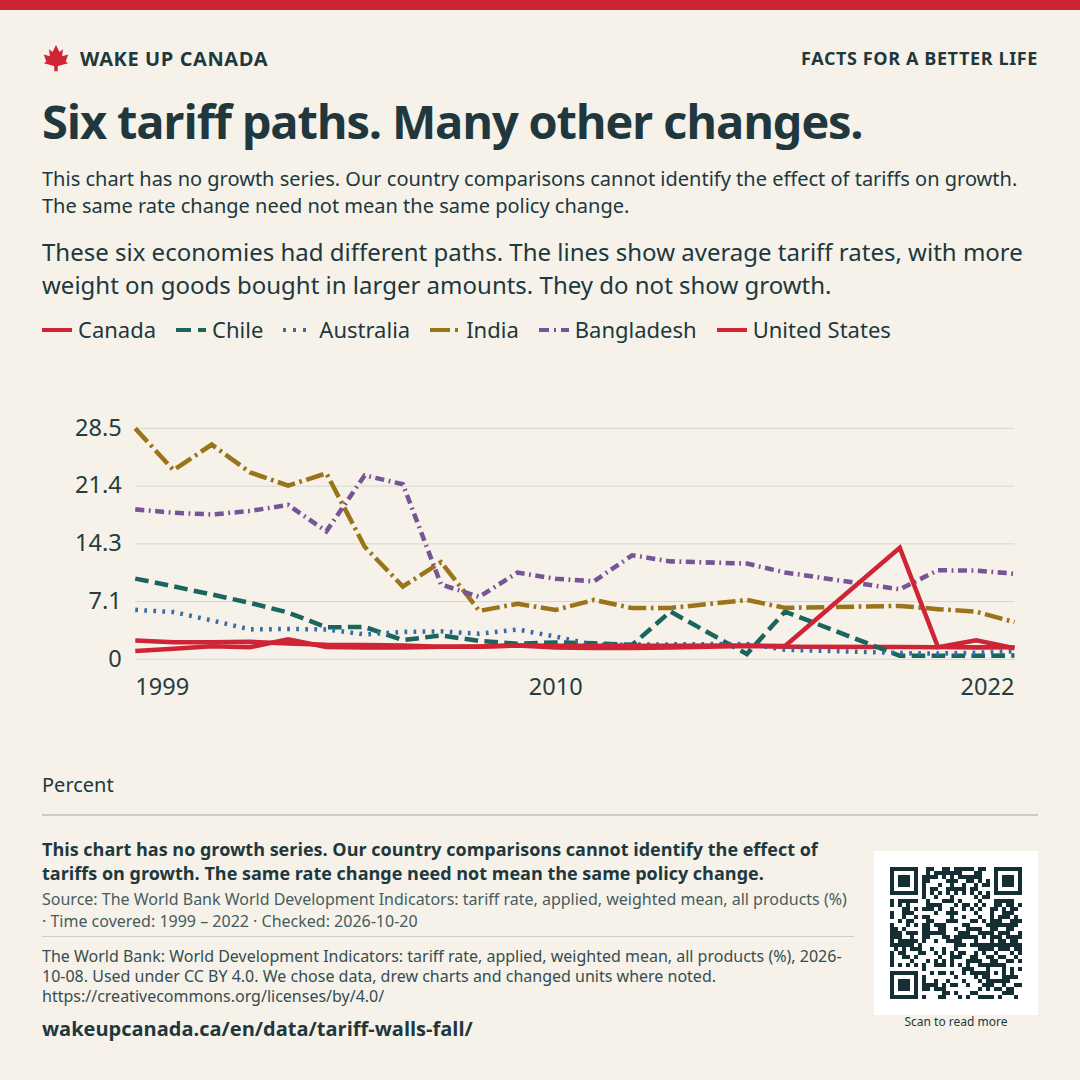
These six economies had different paths. The lines show average tariff rates, with more weight on goods bought in larger amounts. They do not show growth.
Average applied tariff on imports, since 1999
Time covered: 1999 — 2022
Showing: 1999 — 2022
Canada
1.4Last point · 2022 · Percent
Change over 10 years: -0 percentage points2012 → 2022
Chile
0.5Last point · 2022 · Percent
Change over 10 years: -1.3 percentage points2012 → 2022
Australia
1Last point · 2022 · Percent
Change over 10 years: -0.8 percentage points2012 → 2022
India
4.6Last point · 2022 · Percent
Change over 10 years: -1.7 percentage points2012 → 2022
Bangladesh
10.6Last point · 2022 · Percent
Change over 10 years: -2.3 percentage points2012 → 2022
United States
1.5Last point · 2022 · Percent
Change over 10 years: -0.2 percentage points2012 → 2022
Canada 1.4
Chile 0.5
Australia 1
India 4.6
Bangladesh 10.6
United States 1.5
30.822.614.56.3-1.9
19992022
Percent
A change from 6% to 7% is one percentage point.
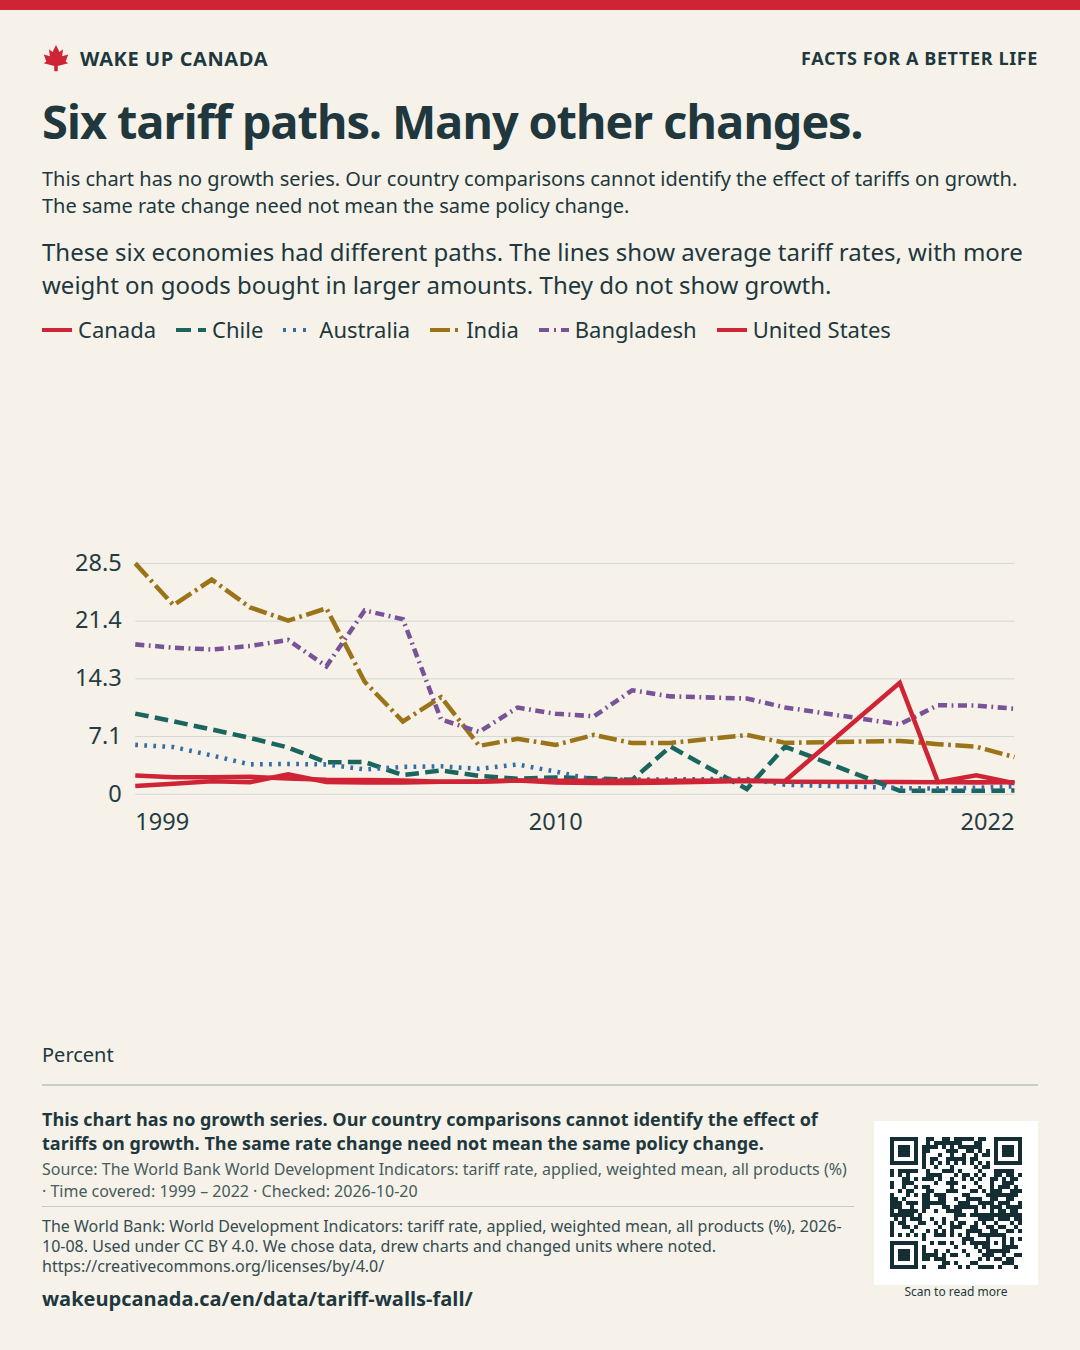
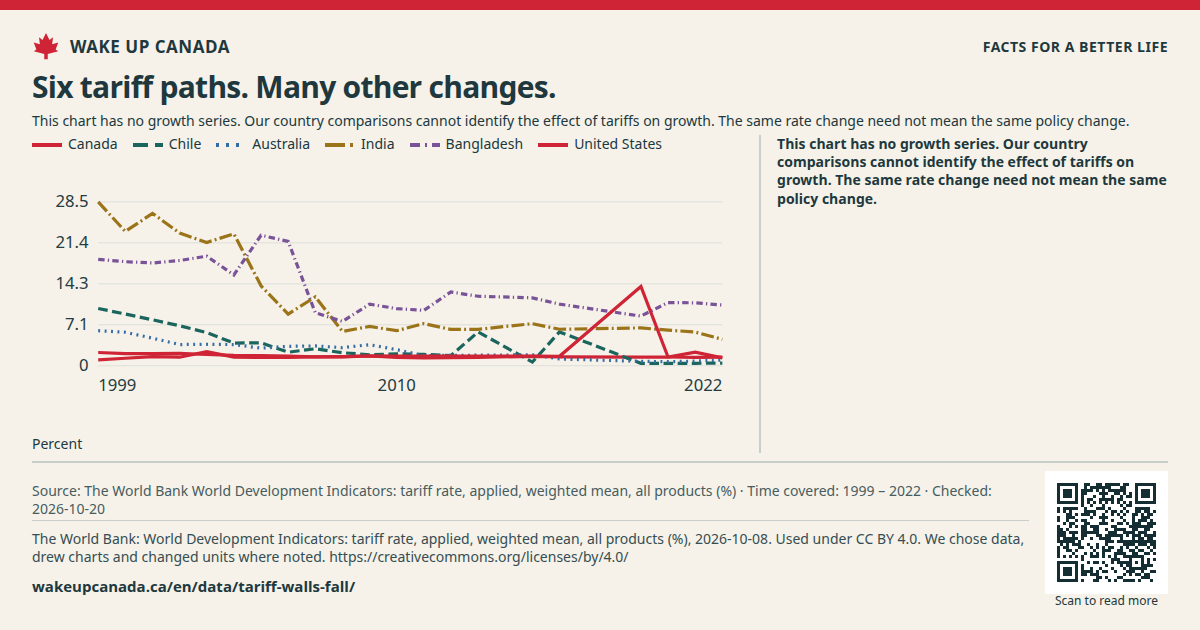
Lines show the weighted average tariff for Canada, Chile, Australia, India, Bangladesh and the United States from 1999 to 2022, in per cent.
Checked:
See all the data
This table has the same values as the chart. You can scroll the table sideways.
Average applied tariff on imports, since 1999 · Percent
A rate chart is a place to start, not a test of cause. A change in the average can come from new rules or from different goods being bought. Use stronger studies to judge effects on growth.
What we want to change
Stop waiting for growth from a tax wall. Drop the wall and count the real gains: lower prices, cheaper parts, more choice.
These six economies had different paths. The lines show average tariff rates, with more weight on goods bought in larger amounts. They do not show growth.
Keep the source, date and notes with the image.
Checked:
What this does not show: This chart has no growth series. Our country comparisons cannot identify the effect of tariffs on growth. The same rate change need not mean the same policy change.