Who owns the home they live in?

A fair path to own should sit beside good homes to rent. Track who owns their main home, and be clear about who the survey counts.

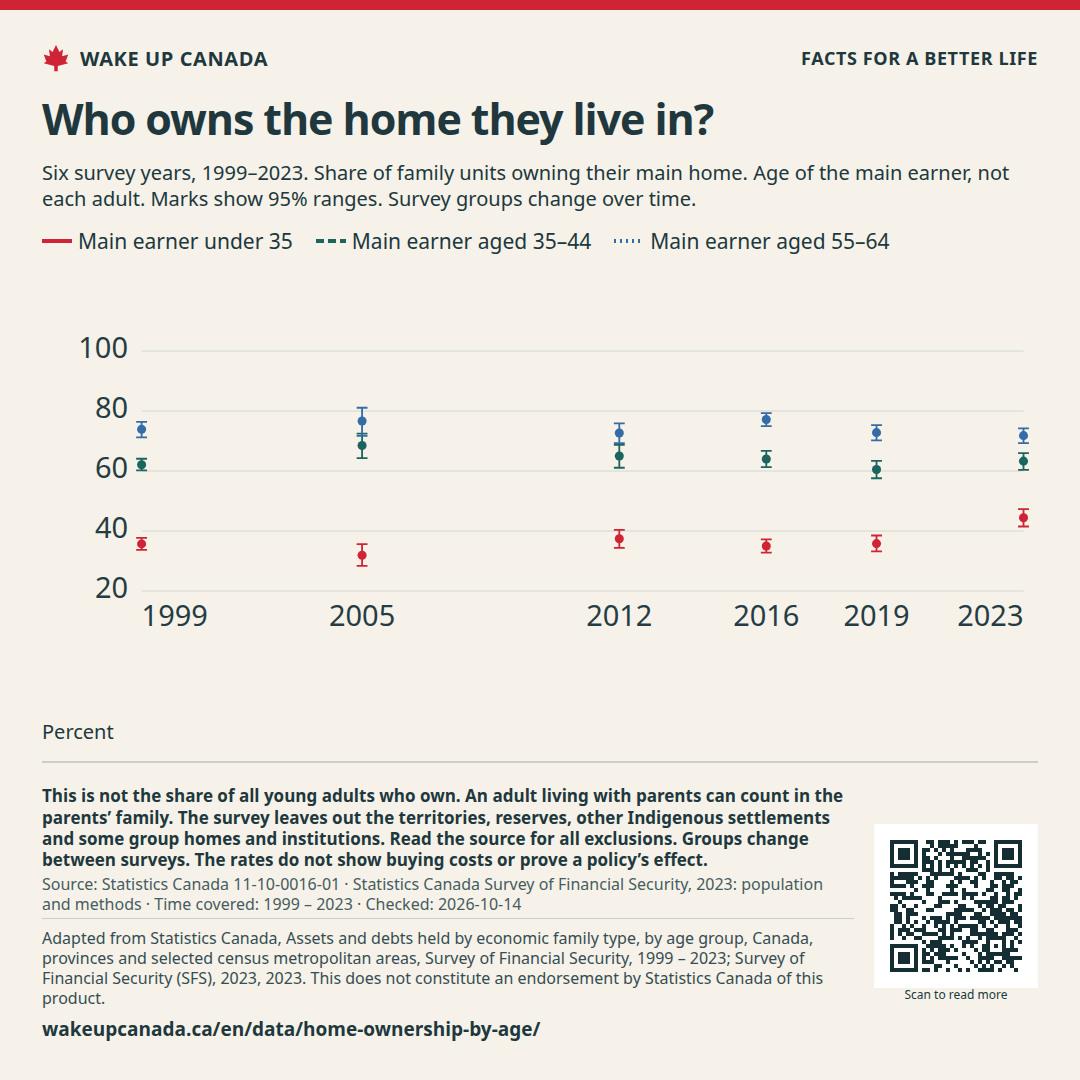
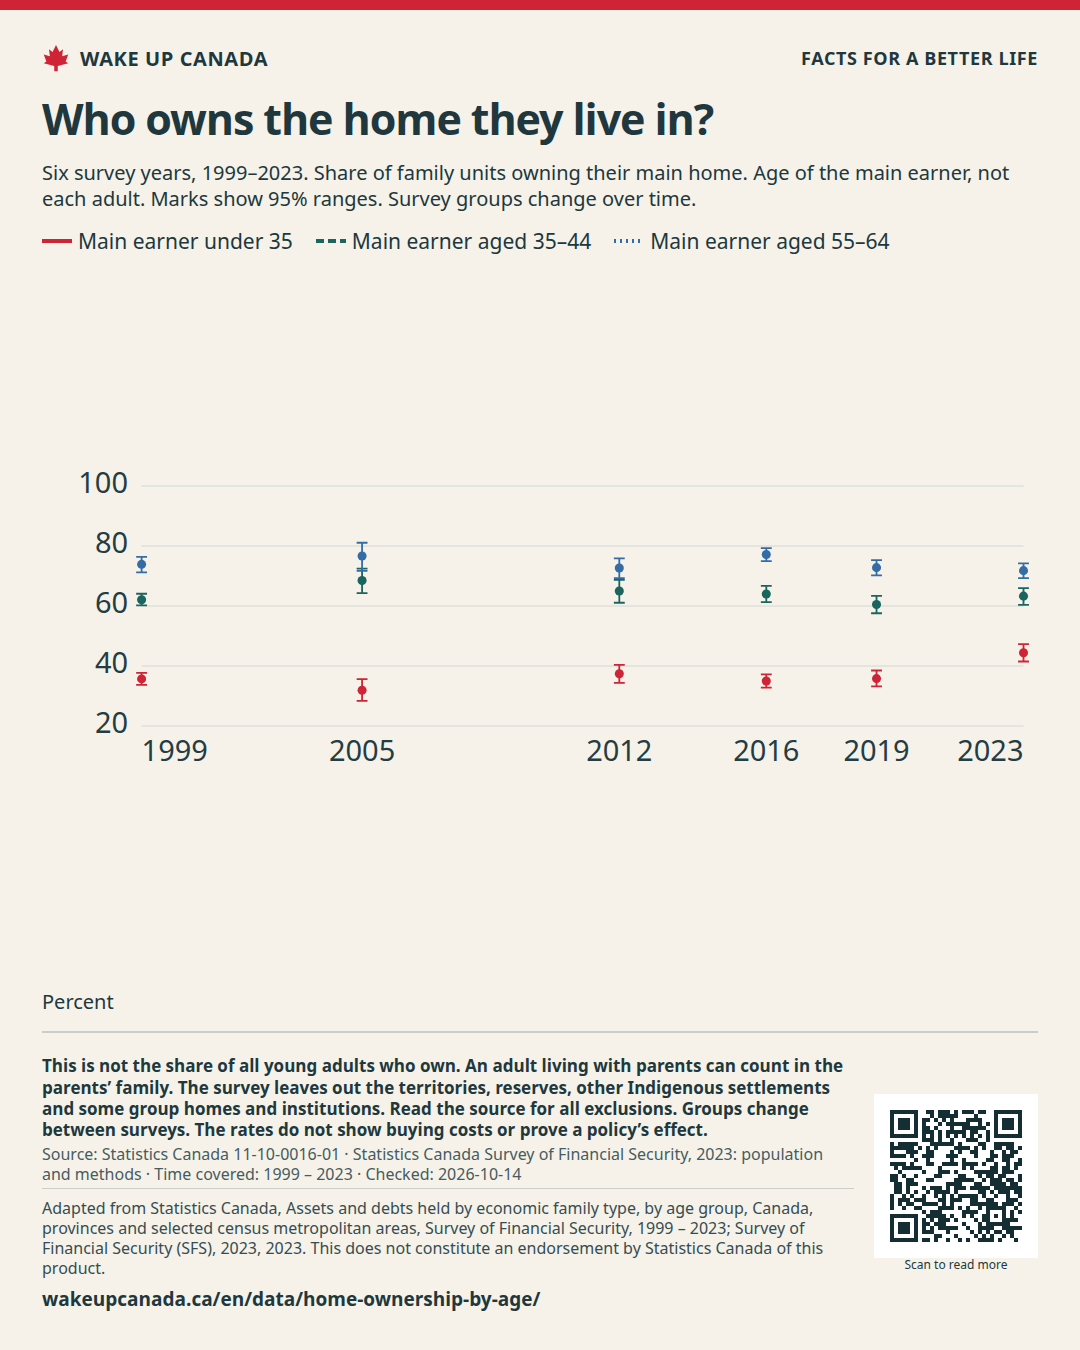
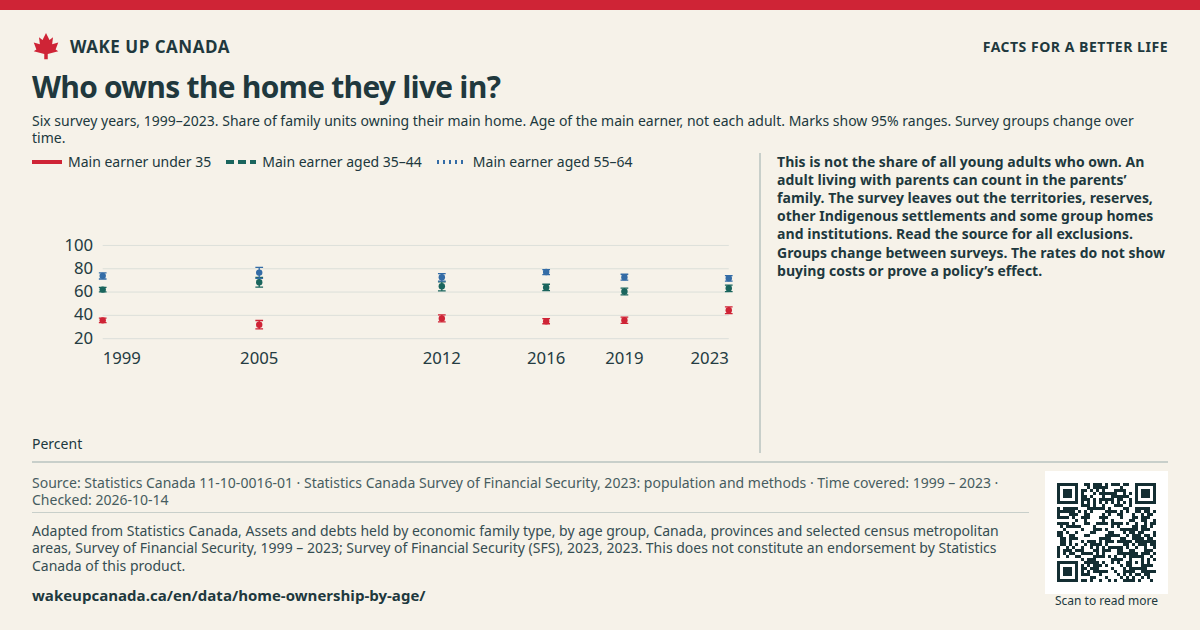
Share of family units that own their main home

Time covered: 1999 — 2023

Choose places or groups (3/8)

Choose up to 8 lines. The table and CSV keep every series.

The first set is a choice, not a ranking. Missing values are not zero.

Showing: 1999 — 2023

Main earner under 35

44.4Last point · 2023 · Share of family units owning their main home (%)

Main earner aged 35–44

63.3Last point · 2023 · Share of family units owning their main home (%)

Main earner aged 55–64

71.8Last point · 2023 · Share of family units owning their main home (%)
  • Main earner under 35 44.4
  • Main earner aged 35–44 63.3
  • Main earner aged 55–64 71.8
Main earner under 35 · 1999: 35.7 · Share of family units owning their main home (%)Main earner under 35 · 2005: 31.9 · Share of family units owning their main home (%)Main earner under 35 · 2012: 37.4 · Share of family units owning their main home (%)Main earner under 35 · 2016: 35 · Share of family units owning their main home (%)Main earner under 35 · 2019: 35.8 · Share of family units owning their main home (%)Main earner under 35 · 2023: 44.4 · Share of family units owning their main home (%)Main earner aged 35–44 · 1999: 62.1 · Share of family units owning their main home (%)Main earner aged 35–44 · 2005: 68.5 · Share of family units owning their main home (%)Main earner aged 35–44 · 2012: 65 · Share of family units owning their main home (%)Main earner aged 35–44 · 2016: 64 · Share of family units owning their main home (%)Main earner aged 35–44 · 2019: 60.5 · Share of family units owning their main home (%)Main earner aged 35–44 · 2023: 63.3 · Share of family units owning their main home (%)Main earner aged 55–64 · 1999: 73.9 · Share of family units owning their main home (%)Main earner aged 55–64 · 2005: 76.7 · Share of family units owning their main home (%)Main earner aged 55–64 · 2012: 72.7 · Share of family units owning their main home (%)Main earner aged 55–64 · 2016: 77.2 · Share of family units owning their main home (%)Main earner aged 55–64 · 2019: 72.8 · Share of family units owning their main home (%)Main earner aged 55–64 · 2023: 71.8 · Share of family units owning their main home (%)
19992023

Share of family units owning their main home (%) · The marks show the survey’s 95% range of doubt.

A change from 6% to 7% is one percentage point.

Dots show six survey years by the main earner’s age. Marks show the source’s 95% ranges. No values are filled in between surveys.

Dated study · Checked:

See all the data

This table has the same values as the chart. You can scroll the table sideways.

Share of family units that own their main home · Share of family units owning their main home (%)
TimeAll ages of main earnerLow end of the rangeHigh end of the rangeMain earner under 35Low end of the rangeHigh end of the rangeMain earner aged 35–44Low end of the rangeHigh end of the rangeMain earner aged 45–54Low end of the rangeHigh end of the rangeMain earner aged 55–64Low end of the rangeHigh end of the rangeMain earner aged 65 and upLow end of the rangeHigh end of the range
199959.6%58.6%60.5%35.7%33.7%37.7%62.1%60.2%64.1%72.1%69.9%74.1%73.9%71.2%76.4%66.9%64.6%69.2%
200561.9%60.2%63.6%31.9%28.4%35.6%68.5%64.3%72.5%74.5%70.9%77.8%76.7%71.7%81.1%69.2%65.5%72.6%
201262.5%61.2%63.8%37.4%34.4%40.4%65%61.1%68.7%71.2%68.4%74%72.7%69.3%75.9%70.8%68.4%73.2%
201661.7%60.8%62.6%35%32.8%37.2%64%61.3%66.7%69.7%67%72.3%77.2%75%79.3%66.9%64.7%69%
201961.9%60.9%62.9%35.8%33.2%38.5%60.5%57.6%63.4%71.9%69%74.6%72.8%70.2%75.3%70.1%67.9%72.2%
202364.7%63.7%65.8%44.4%41.5%47.3%63.3%60.4%66%72.9%70.4%75.3%71.8%69.3%74.2%70.3%68.4%72%
Download the data (CSV) ↓

Why this matters

Ownership can help people build wealth. We want the path to be open to more people, without treating renters as a failure or promising a sure return.

What we want to change

Allow small homes, flats and safe ways to split lots. Track the full cost to buy and rent. Give people real choices near work and daily needs.

Back a plan for change

Sources

  1. Statistics Canada · 11-10-0016-01 ↗

    Source released:

  2. Statistics Canada · Survey of Financial Security, 2023: population and methods ↗

WAKE UP CANADA

Share the case for change

Help more people see the facts and the plan.

Who owns the home they live in?

A fair path to own should sit beside good homes to rent. Track who owns their main home, and be clear about who the survey counts.

Keep the source, date and notes with the image.

Checked:

What this does not show: This is not the share of all young adults who own. An adult living with parents can count in the parents’ family. The survey leaves out the territories, reserves, other Indigenous settlements and some group homes and institutions. Read the source for all exclusions. Groups change between surveys. The rates do not show buying costs or prove a policy’s effect.

wakeupcanada.ca/en/data/home-ownership-by-age/
Scan to open this page
Scan this code to read the full case.

Save an image

If the image opens in a new tab, press and hold it or use your browser’s save tool.

Sources and notes