All data stories / Taxes and public money
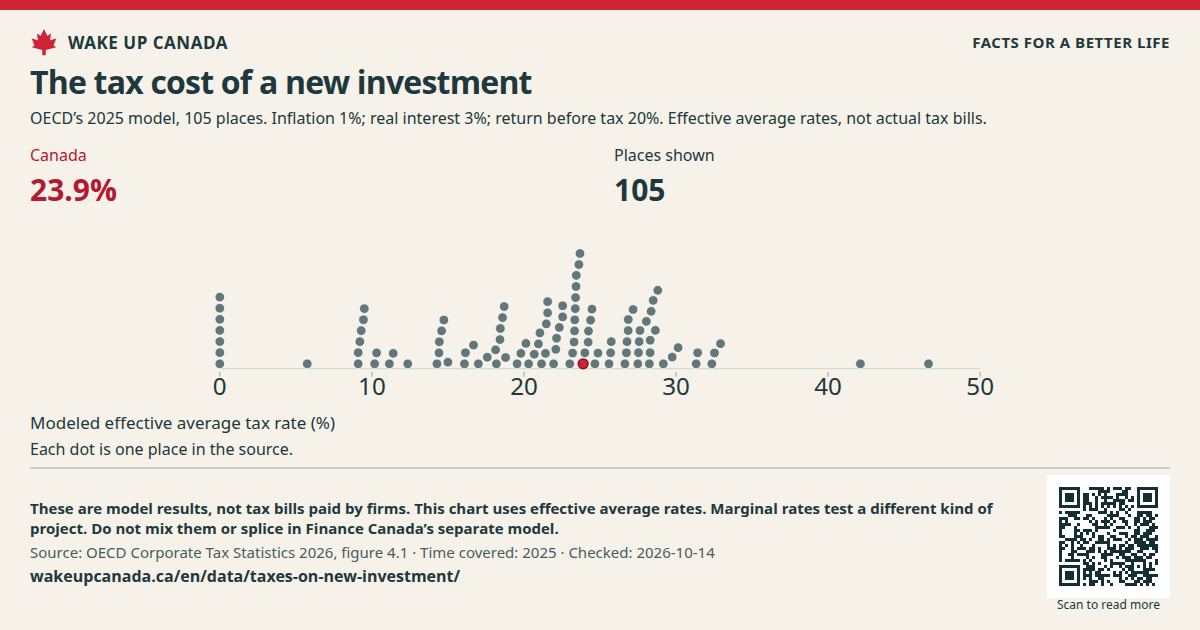
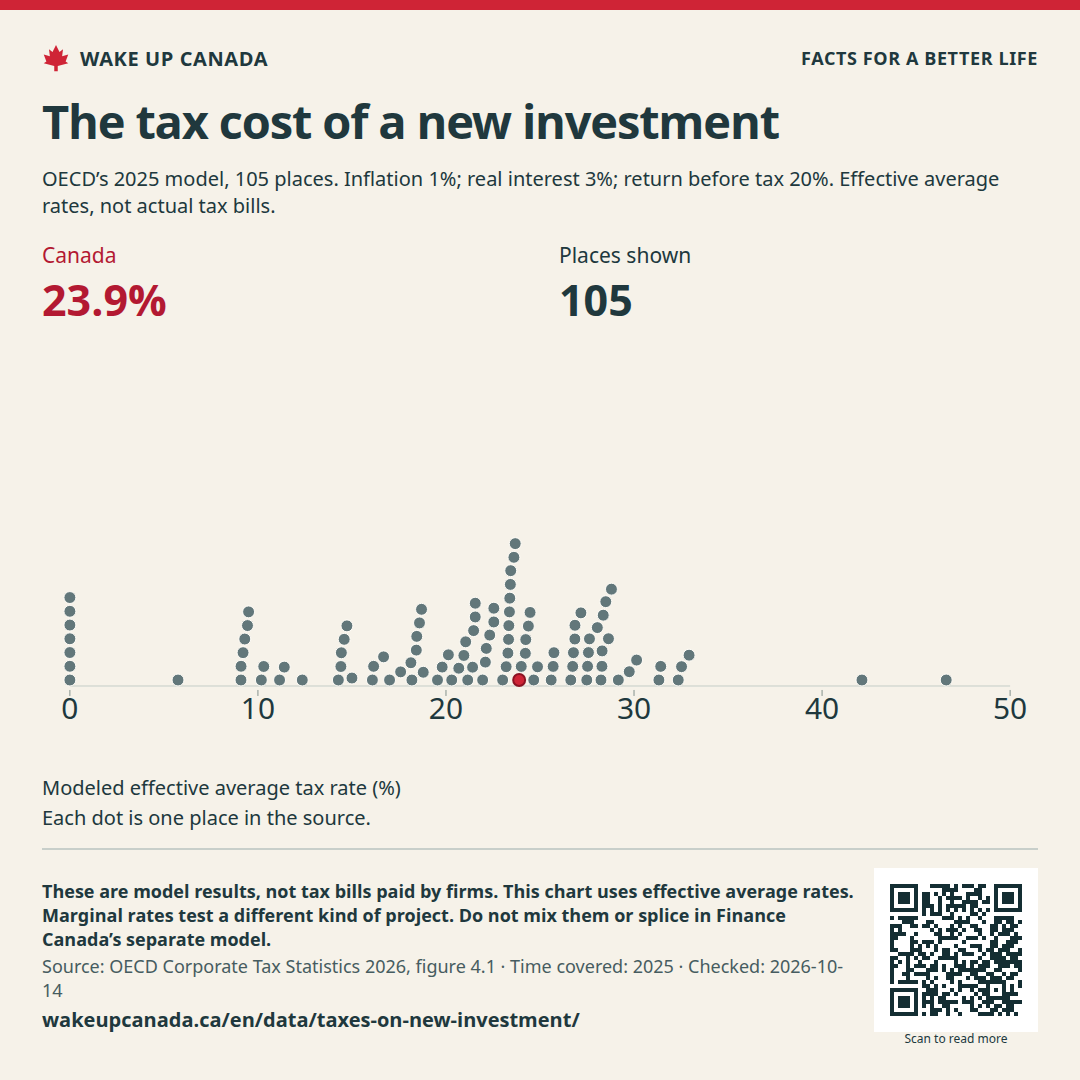
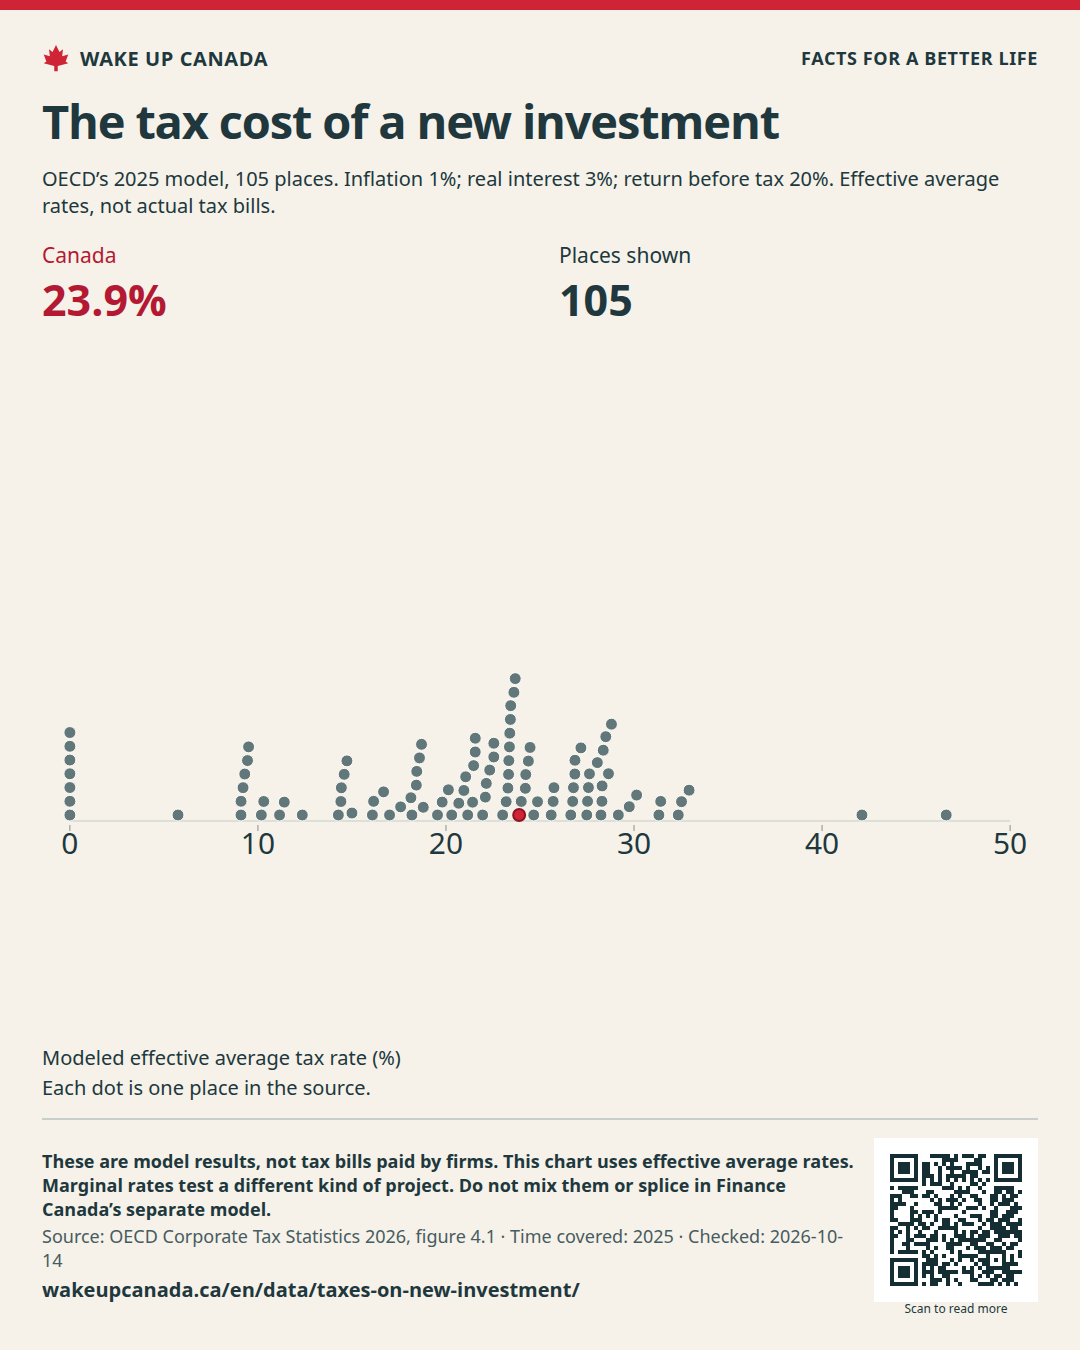
The tax cost of a new investment Tax rates on paper do not show the whole cost of a new plant or machine. The OECD models a test project to compare 105 places.
Modeled effective average tax rates, 2025 Time covered: 2025
Canada 23.9%
Places shown 105 Bahamas: 0% Cayman Islands: 0% Guernsey: 0% Isle of Man: 0% Jersey: 0% Turks & Caicos Islands: 0% British Virgin Islands: 0% Mauritius: 5.7% Bulgaria: 9.1% Qatar: 9.1% Bosnia & Herzegovina: 9.2% North Macedonia: 9.3% Paraguay: 9.4% Andorra: 9.5% Liechtenstein: 10.2% Hungary: 10.3% Macao SAR China: 11.2% Cyprus: 11.4% Ireland: 12.4% Hong Kong SAR China: 14.3% Romania: 14.4% Serbia: 14.4% Lithuania: 14.6% Albania: 14.7% Poland: 15% Singapore: 16.1% Croatia: 16.2% Ukraine: 16.7% Latvia: 17% Armenia: 17.6% Vietnam: 18.1% Tunisia: 18.2% Switzerland: 18.4% Thailand: 18.4% Saudi Arabia: 18.6% Estonia: 18.7% Iceland: 18.8% Sweden: 19.5% Finland: 19.8% Slovenia: 20.1% Czechia: 20.3% Egypt: 20.7% Azerbaijan: 21% Greece: 21% Curaçao: 21.2% Norway: 21.4% Israel: 21.5% Denmark: 21.6% Indonesia: 21.6% Austria: 21.9% Slovakia: 22.1% United States: 22.1% Türkiye: 22.3% Luxembourg: 22.5% United Kingdom: 22.5% China: 23% Seychelles: 23.2% Spain: 23.3% Panama: 23.3% Ecuador: 23.3% Guatemala: 23.4% Belgium: 23.4% Malaysia: 23.4% Chile: 23.4% France: 23.6% Angola: 23.7% Canada: 23.9% India: 24% Jamaica: 24.2% Uruguay: 24.2% South Africa: 24.4% Netherlands: 24.5% Antigua & Barbuda: 24.7% South Korea: 24.9% Dominican Republic: 25.6% Eswatini: 25.7% Italy: 25.7% Bolivia: 26.6% Nigeria: 26.7% Germany: 26.8% Nicaragua: 26.9% New Zealand: 26.9% Kenya: 27.2% El Salvador: 27.5% Portugal: 27.5% Congo - Kinshasa: 27.6% Mexico: 27.6% Benin: 28% Costa Rica: 28.2% Honduras: 28.3% Montserrat: 28.3% Japan: 28.4% Australia: 28.5% Senegal: 28.6% Malta: 28.8% Peru: 29.2% Liberia: 29.7% Papua New Guinea: 30.1% Botswana: 31.3% Namibia: 31.4% Argentina: 32.4% Brazil: 32.5% Colombia: 32.9% Zambia: 42.1% Cameroon: 46.6% 0 10 20 30 40 50
Modeled effective average tax rate (%)
Each dot is one place in the source.
See every place Shown from low to high · Modeled effective average tax rate (%)
0 50
Bahamas 0%
Cayman Islands 0%
Guernsey 0%
Isle of Man 0%
Jersey 0%
Turks & Caicos Islands 0%
British Virgin Islands 0%
Mauritius 5.7%
Bulgaria 9.1%
Qatar 9.1%
Bosnia & Herzegovina 9.2%
North Macedonia 9.3%
Paraguay 9.4%
Andorra 9.5%
Liechtenstein 10.2%
Hungary 10.3%
Macao SAR China 11.2%
Cyprus 11.4%
Ireland 12.4%
Hong Kong SAR China 14.3%
Romania 14.4%
Serbia 14.4%
Lithuania 14.6%
Albania 14.7%
Poland 15%
Singapore 16.1%
Croatia 16.2%
Ukraine 16.7%
Latvia 17%
Armenia 17.6%
Vietnam 18.1%
Tunisia 18.2%
Switzerland 18.4%
Thailand 18.4%
Saudi Arabia 18.6%
Estonia 18.7%
Iceland 18.8%
Sweden 19.5%
Finland 19.8%
Slovenia 20.1%
Czechia 20.3%
Egypt 20.7%
Azerbaijan 21%
Greece 21%
Curaçao 21.2%
Norway 21.4%
Israel 21.5%
Denmark 21.6%
Indonesia 21.6%
Austria 21.9%
Slovakia 22.1%
United States 22.1%
Türkiye 22.3%
Luxembourg 22.5%
United Kingdom 22.5%
China 23%
Seychelles 23.2%
Spain 23.3%
Panama 23.3%
Ecuador 23.3%
Guatemala 23.4%
Belgium 23.4%
Malaysia 23.4%
Chile 23.4%
France 23.6%
Angola 23.7%
Canada 23.9%
India 24%
Jamaica 24.2%
Uruguay 24.2%
South Africa 24.4%
Netherlands 24.5%
Antigua & Barbuda 24.7%
South Korea 24.9%
Dominican Republic 25.6%
Eswatini 25.7%
Italy 25.7%
Bolivia 26.6%
Nigeria 26.7%
Germany 26.8%
Nicaragua 26.9%
New Zealand 26.9%
Kenya 27.2%
El Salvador 27.5%
Portugal 27.5%
Congo - Kinshasa 27.6%
Mexico 27.6%
Benin 28%
Costa Rica 28.2%
Honduras 28.3%
Montserrat 28.3%
Japan 28.4%
Australia 28.5%
Senegal 28.6%
Malta 28.8%
Peru 29.2%
Liberia 29.7%
Papua New Guinea 30.1%
Botswana 31.3%
Namibia 31.4%
Argentina 32.4%
Brazil 32.5%
Colombia 32.9%
Zambia 42.1%
Cameroon 46.6%
This table has the same values as the chart. You can scroll the table sideways.
Download the full comparison table ↓ The OECD’s model compares the tax cost of a new investment in 105 places. Canada is marked.
Checked: Oct 14, 2026
Why this matters We want it to cost less to build and grow a firm. Compare the rules on costs and tax breaks as well as headline rates.
What we want to change Lower the tax cost of useful new work. Show the budget cost and test what changes after each reform.
What this does not show These are model results, not tax bills paid by firms. This chart uses effective average rates. Marginal rates test a different kind of project. Do not mix them or splice in Finance Canada’s separate model.
Read this fairly Finance Canada’s Budget 2025 model puts Canada lowest in the G7 after its planned changes. The OECD model gives a different view. The methods, rules and costs counted differ; neither is a score for the whole economy.
How we made this chart The OECD’s 2026 report models 2025 rules. It sets inflation at 1%, the real interest rate at 3% and the return before tax at 20%. It uses a set mix of assets and debt and equity funding.