All data stories / A fair chance
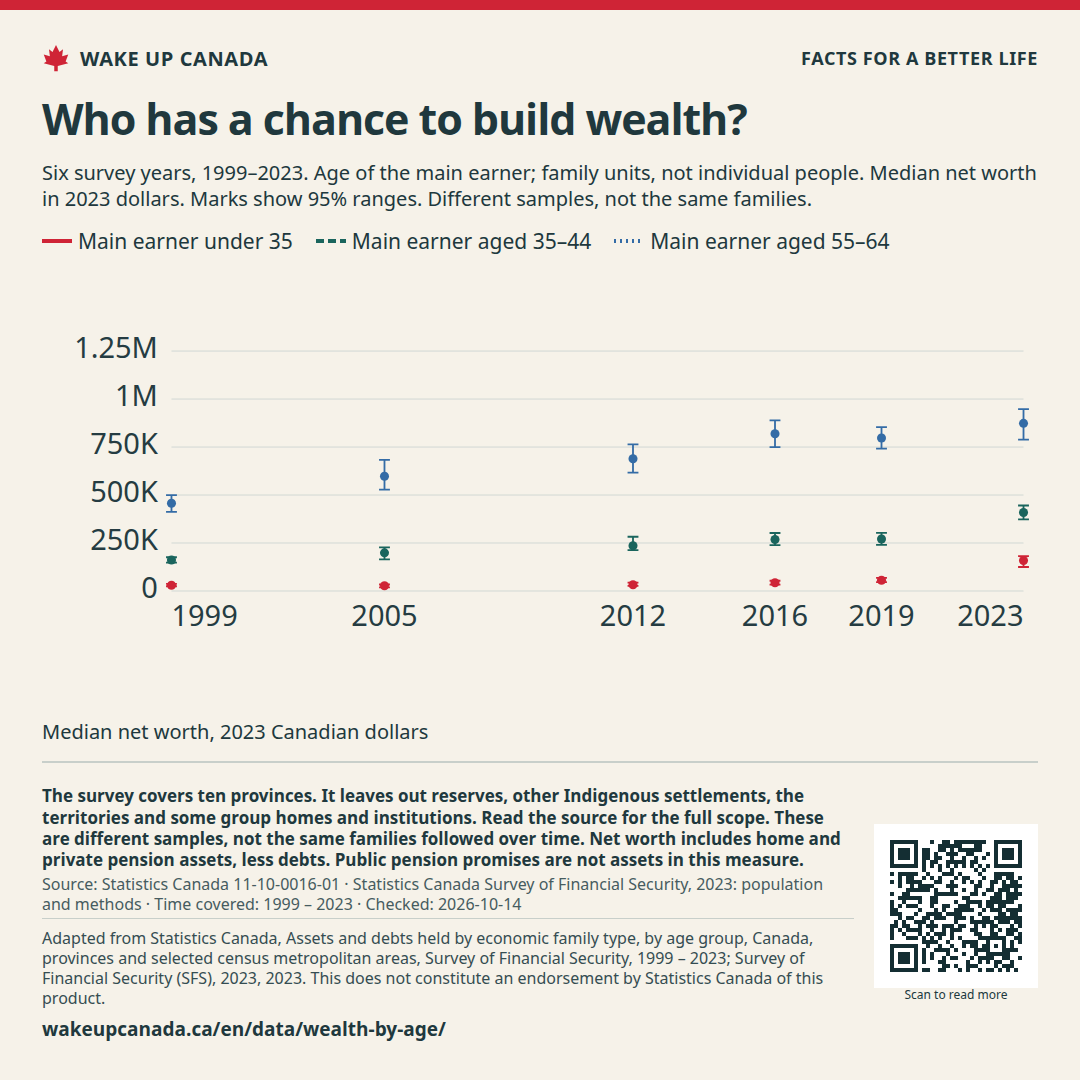
Who has a chance to build wealth? Net worth is what a family owns, less what it owes. These survey results show the middle net worth of each age group, with price changes removed.
Median net worth by the top earner’s age Time covered: 1999 — 2023
Full history Past 20 years Past 10 years
Choose places or groups (3/8) Choose up to 8 lines. The table and CSV keep every series.
The first set is a choice, not a ranking. Missing values are not zero.
Find a place or group All ages of main earnerYears in this source: 1999 – 2023 Main earner under 35Years in this source: 1999 – 2023 Main earner aged 35–44Years in this source: 1999 – 2023 Main earner aged 45–54Years in this source: 1999 – 2023 Main earner aged 55–64Years in this source: 1999 – 2023 Main earner aged 65 and upYears in this source: 1999 – 2023
Use the starting set Showing: 1999 — 2023
Main earner under 35
159,100 Last point · 2023 · Median net worth, 2023 Canadian dollars Main earner aged 35–44
409,300 Last point · 2023 · Median net worth, 2023 Canadian dollars Main earner aged 55–64
873,400 Last point · 2023 · Median net worth, 2023 Canadian dollars Main earner under 35 159,100 Main earner aged 35–44 409,300 Main earner aged 55–64 873,400 1,250,000 1,000,000 750,000 500,000 250,000 0
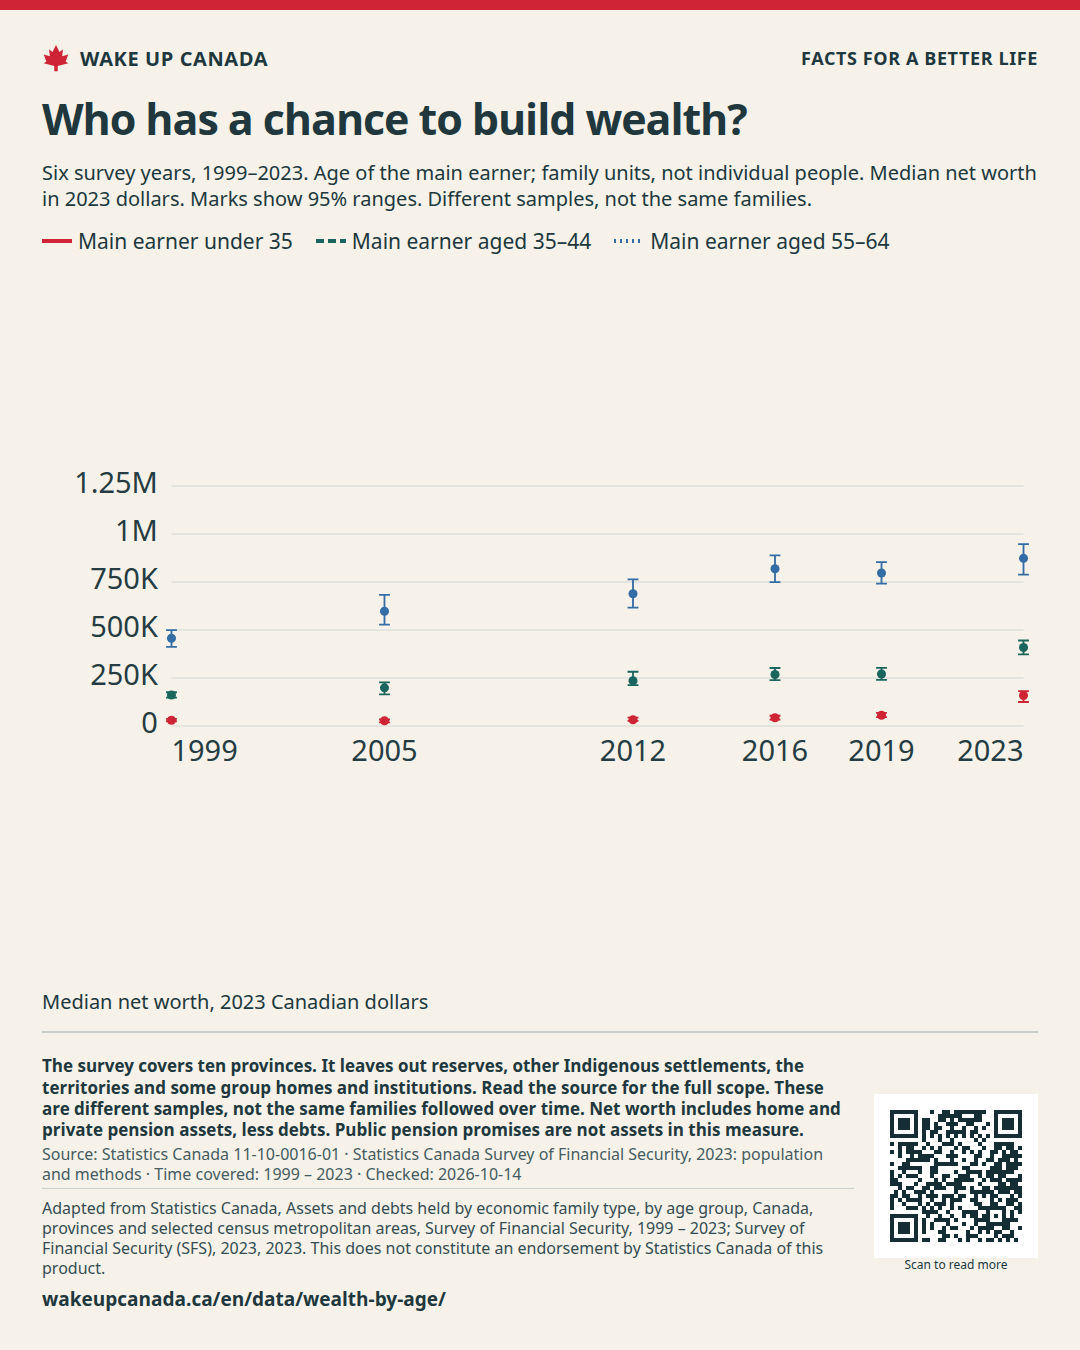
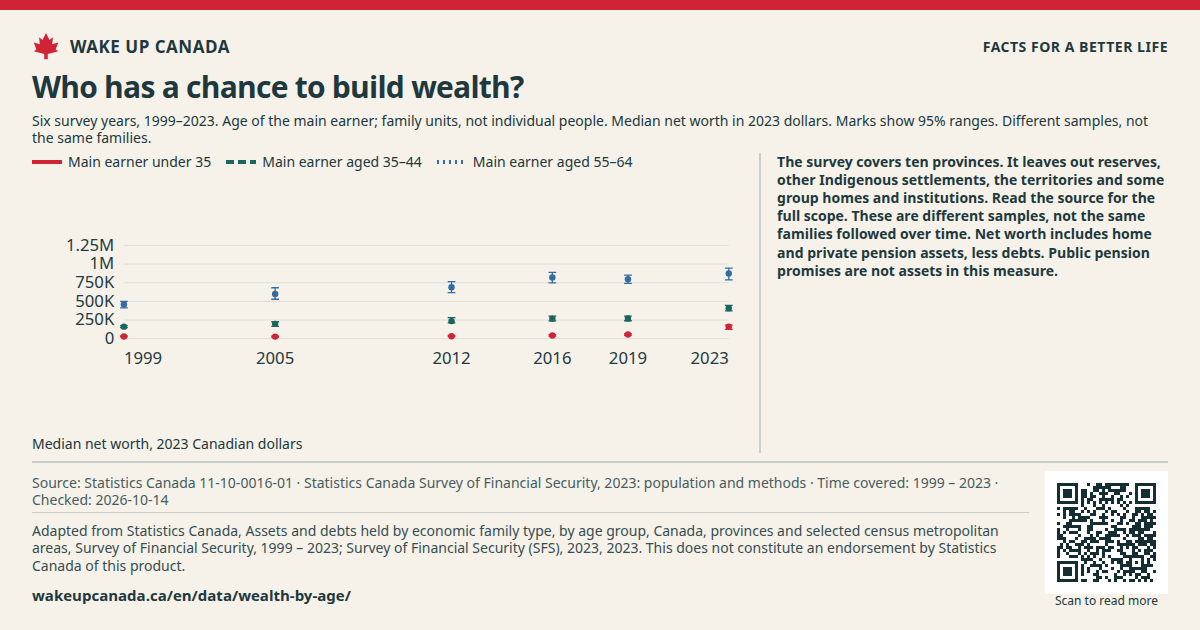
Main earner under 35 · 1999: 30,000 · Median net worth, 2023 Canadian dollars Main earner under 35 · 2005: 27,500 · Median net worth, 2023 Canadian dollars Main earner under 35 · 2012: 32,600 · Median net worth, 2023 Canadian dollars Main earner under 35 · 2016: 43,000 · Median net worth, 2023 Canadian dollars Main earner under 35 · 2019: 56,400 · Median net worth, 2023 Canadian dollars Main earner under 35 · 2023: 159,100 · Median net worth, 2023 Canadian dollars Main earner aged 35–44 · 1999: 161,200 · Median net worth, 2023 Canadian dollars Main earner aged 35–44 · 2005: 198,800 · Median net worth, 2023 Canadian dollars Main earner aged 35–44 · 2012: 235,600 · Median net worth, 2023 Canadian dollars Main earner aged 35–44 · 2016: 268,600 · Median net worth, 2023 Canadian dollars Main earner aged 35–44 · 2019: 270,800 · Median net worth, 2023 Canadian dollars Main earner aged 35–44 · 2023: 409,300 · Median net worth, 2023 Canadian dollars Main earner aged 55–64 · 1999: 457,300 · Median net worth, 2023 Canadian dollars Main earner aged 55–64 · 2005: 598,200 · Median net worth, 2023 Canadian dollars Main earner aged 55–64 · 2012: 688,900 · Median net worth, 2023 Canadian dollars Main earner aged 55–64 · 2016: 819,200 · Median net worth, 2023 Canadian dollars Main earner aged 55–64 · 2019: 797,000 · Median net worth, 2023 Canadian dollars Main earner aged 55–64 · 2023: 873,400 · Median net worth, 2023 Canadian dollars 1999 2023
Median net worth, 2023 Canadian dollars · The marks show the survey’s 95% range of doubt.
Dots show six survey years. Each bar through a dot shows the source’s 95% range. There are no values or lines for the years between surveys.
Dated study · Checked: Oct 14, 2026
See all the data This table has the same values as the chart. You can scroll the table sideways.
Download the data (CSV) ↓ Why this matters We want more people to build assets and have a buffer for hard times. Track young families as well as older ones. Gains at the top do not tell us how everyone lives.
What we want to change Make room for homes people can rent or buy. Show the full costs and risks of loans. Help people build wealth without a bet on ever-rising house prices.
What this does not show The survey covers ten provinces. It leaves out reserves, other Indigenous settlements, the territories and some group homes and institutions. Read the source for the full scope. These are different samples, not the same families followed over time. Net worth includes home and private pension assets, less debts. Public pension promises are not assets in this measure.
Read this fairly The under-35 median rose from $56,400 in 2019 to $159,100 in 2023. That is progress in this survey. It does not mean every young family gained or that homes will keep rising in price.
How we made this chart We use the Survey of Financial Security for 1999, 2005, 2012, 2016, 2019 and 2023. Age means the age of the main earner. The units are families and people outside a family, not all households or each person. Median means the middle value. All money uses 2023 prices. Zero and negative net worth are included.