Close the gap in access to work

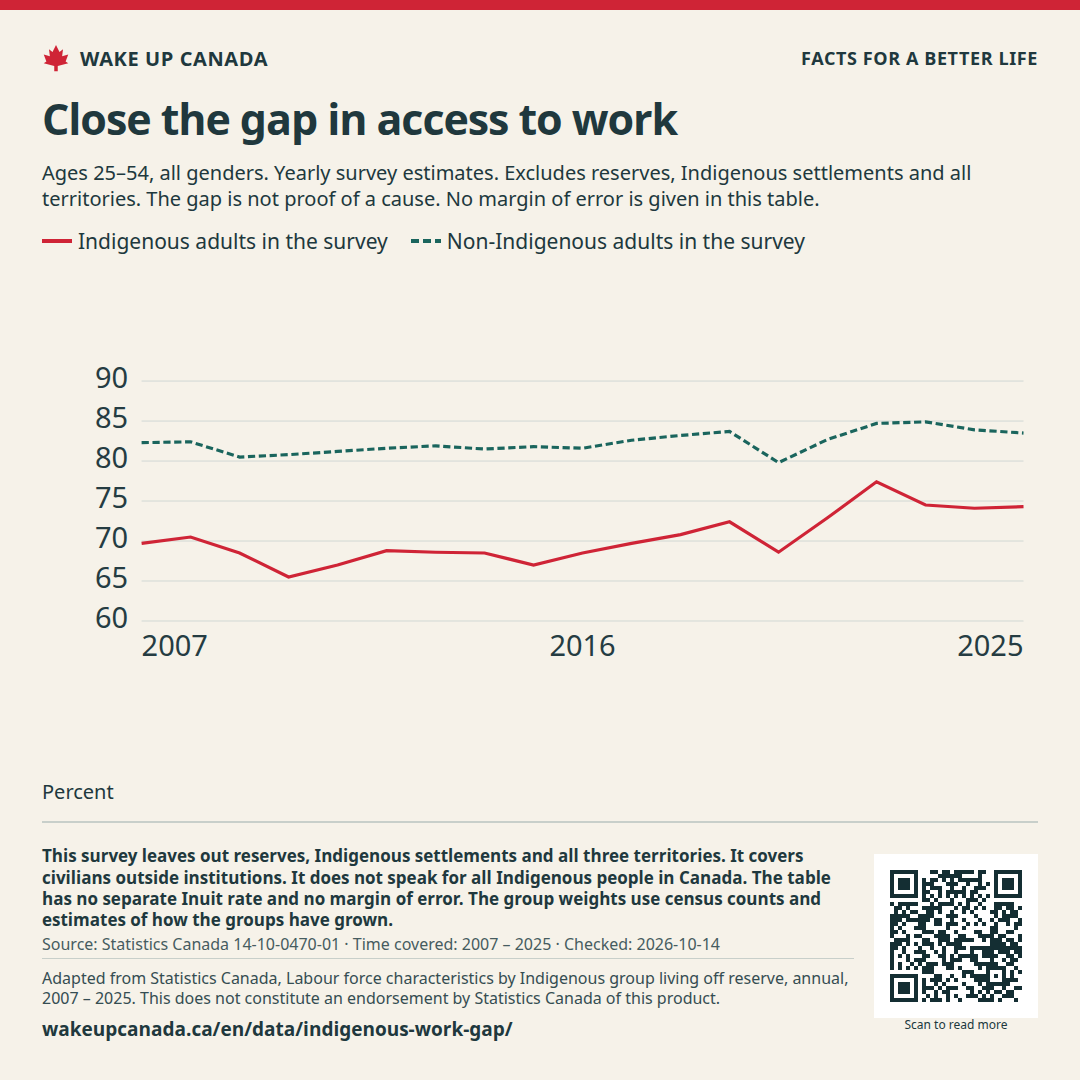
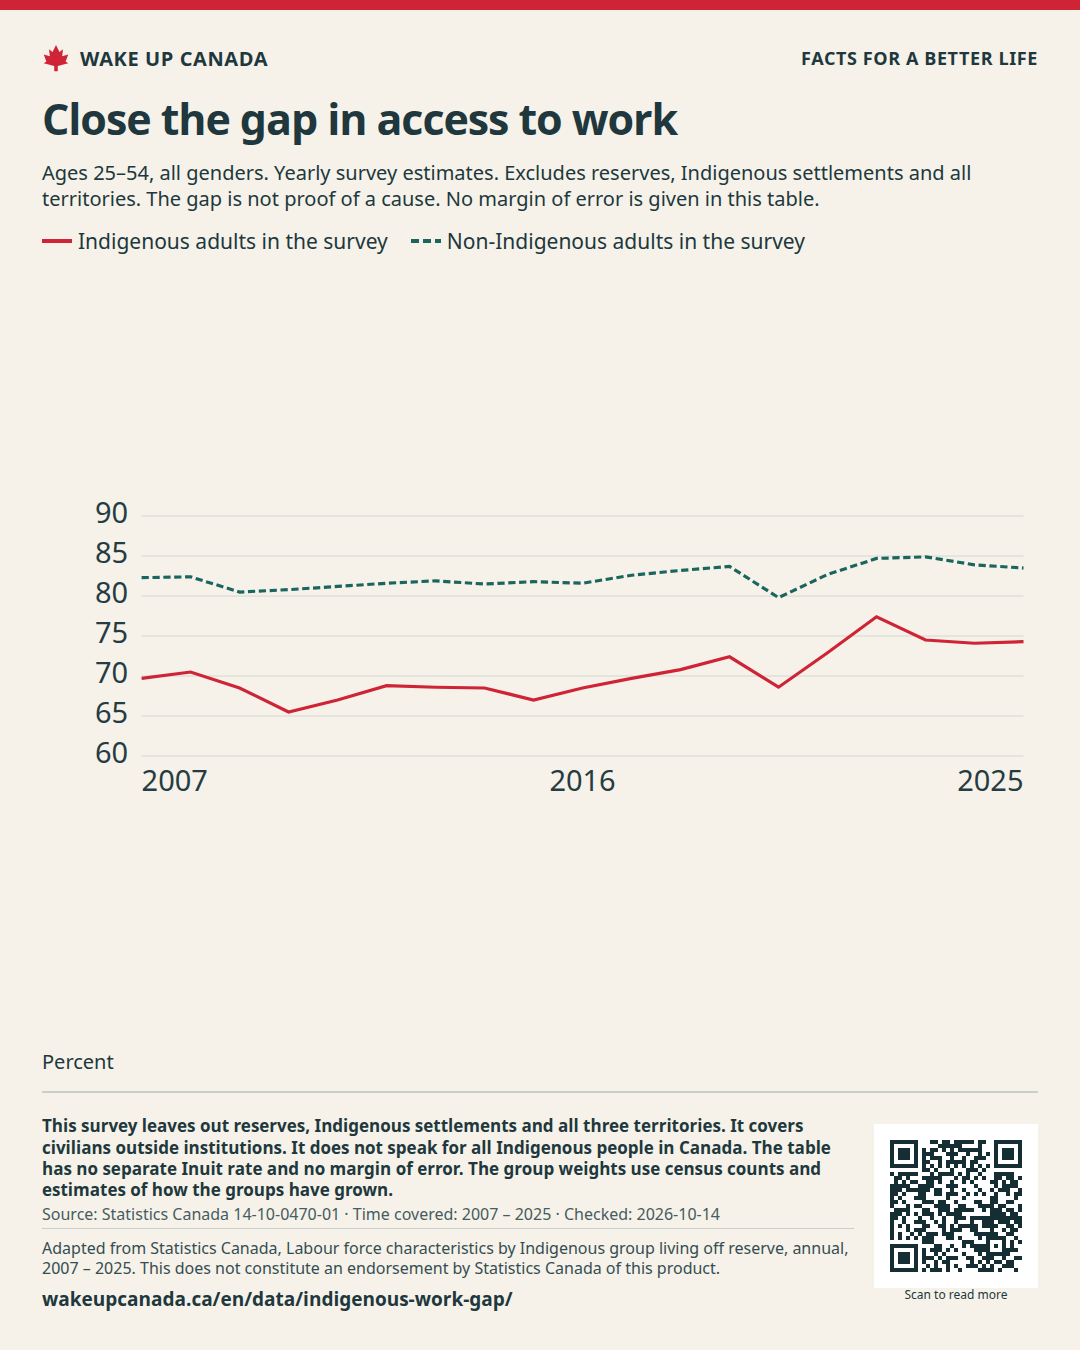
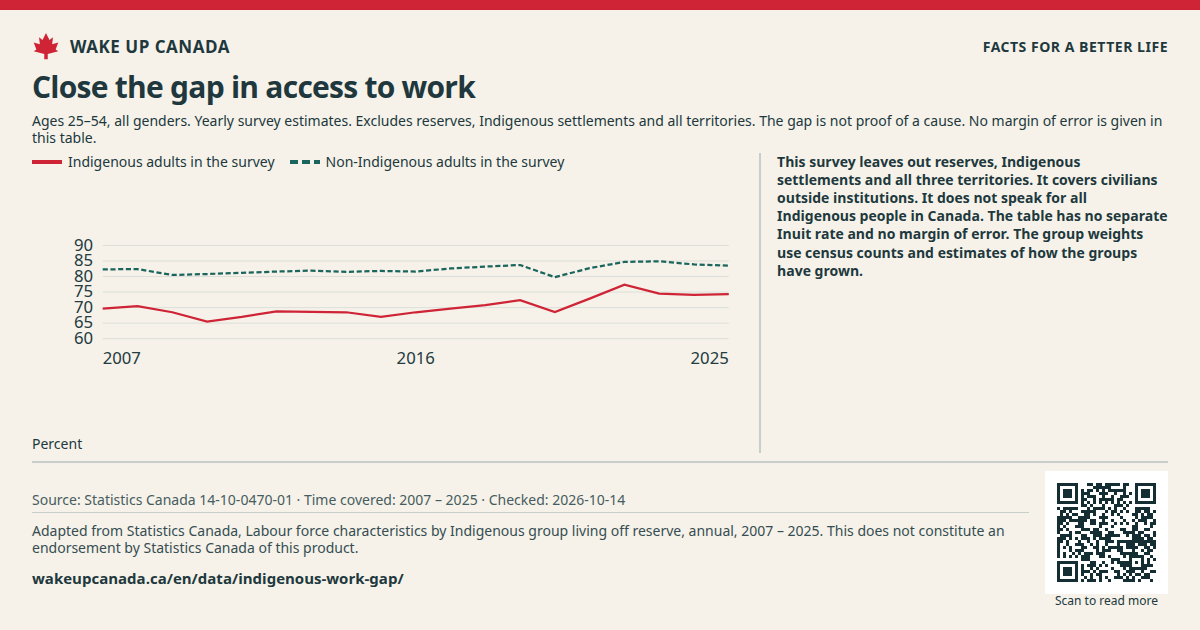
More people should have a fair chance to work. These survey rates show a gap for Indigenous adults aged 25 to 54. They also show progress since 2007.

Share of adults aged 25–54 in work

Time covered: 2007 — 2025

Choose places or groups (2/8)

Choose up to 8 lines. The table and CSV keep every series.

The first set is a choice, not a ranking. Missing values are not zero.

Showing: 2007 — 2025

Indigenous adults in the survey

74.3Last point · 2025 · Share of the age group in work (%)

Change over 10 years: +7.3 percentage points2015 → 2025

Non-Indigenous adults in the survey

83.5Last point · 2025 · Share of the age group in work (%)

Change over 10 years: +1.7 percentage points2015 → 2025

  • Indigenous adults in the survey 74.3
  • Non-Indigenous adults in the survey 83.5
20072025

Share of the age group in work (%)

A change from 6% to 7% is one percentage point.

Lines compare the share in work among Indigenous and non-Indigenous adults in the survey. Separate First Nations and Métis lines can also be chosen.

Dated release · Checked:

See all the data

This table has the same values as the chart. You can scroll the table sideways.

Share of adults aged 25–54 in work · Share of the age group in work (%)
TimeIndigenous adults in the surveyNon-Indigenous adults in the surveyFirst Nations adults in the surveyMétis adults in the survey
200769.7%82.3%65.2%73.9%
200870.5%82.4%65.2%75.9%
200968.5%80.5%63.7%74%
201065.5%80.8%60.9%71.1%
201167%81.2%60.9%73.8%
201268.8%81.6%64.8%73.7%
201368.6%81.9%63.9%74.4%
201468.5%81.5%64.9%72.9%
201567%81.8%62.2%72.8%
201668.5%81.6%62.9%74.7%
201769.7%82.6%64.4%75.6%
201870.8%83.2%67.2%75.7%
201972.4%83.7%67.5%78%
202068.6%79.8%64.5%73.1%
202172.9%82.7%66.9%79.9%
202277.4%84.7%72.7%82.3%
202374.5%84.9%70.3%79.9%
202474.1%83.9%70%79.1%
202574.3%83.5%70.1%79.8%
Download the data (CSV) ↓

Why this matters

In 2025, the shares in work were 74.3% and 83.5%. That gap should spur action. The survey cannot tell us which barrier caused it.

What we want to change

Work with Indigenous groups to find and remove barriers to jobs. Set clear goals for training, child care and travel to work. Report what improves.

Back a plan for change

Sources

  1. Statistics Canada · 14-10-0470-01 ↗

    Source released:

WAKE UP CANADA

Share the case for change

Help more people see the facts and the plan.

Close the gap in access to work

More people should have a fair chance to work. These survey rates show a gap for Indigenous adults aged 25 to 54. They also show progress since 2007.

Keep the source, date and notes with the image.

Checked:

What this does not show: This survey leaves out reserves, Indigenous settlements and all three territories. It covers civilians outside institutions. It does not speak for all Indigenous people in Canada. The table has no separate Inuit rate and no margin of error. The group weights use census counts and estimates of how the groups have grown.

wakeupcanada.ca/en/data/indigenous-work-gap/
Scan to open this page
Scan this code to read the full case.

Save an image

If the image opens in a new tab, press and hold it or use your browser’s save tool.

Sources and notes