Six provinces lost ground in 2024.
On this measure, real GDP per person fell in six provinces in 2024. It rose in Newfoundland and Labrador, Prince Edward Island, Nova Scotia and Saskatchewan. The source data ends in 2024. [1][2]
Report · Published
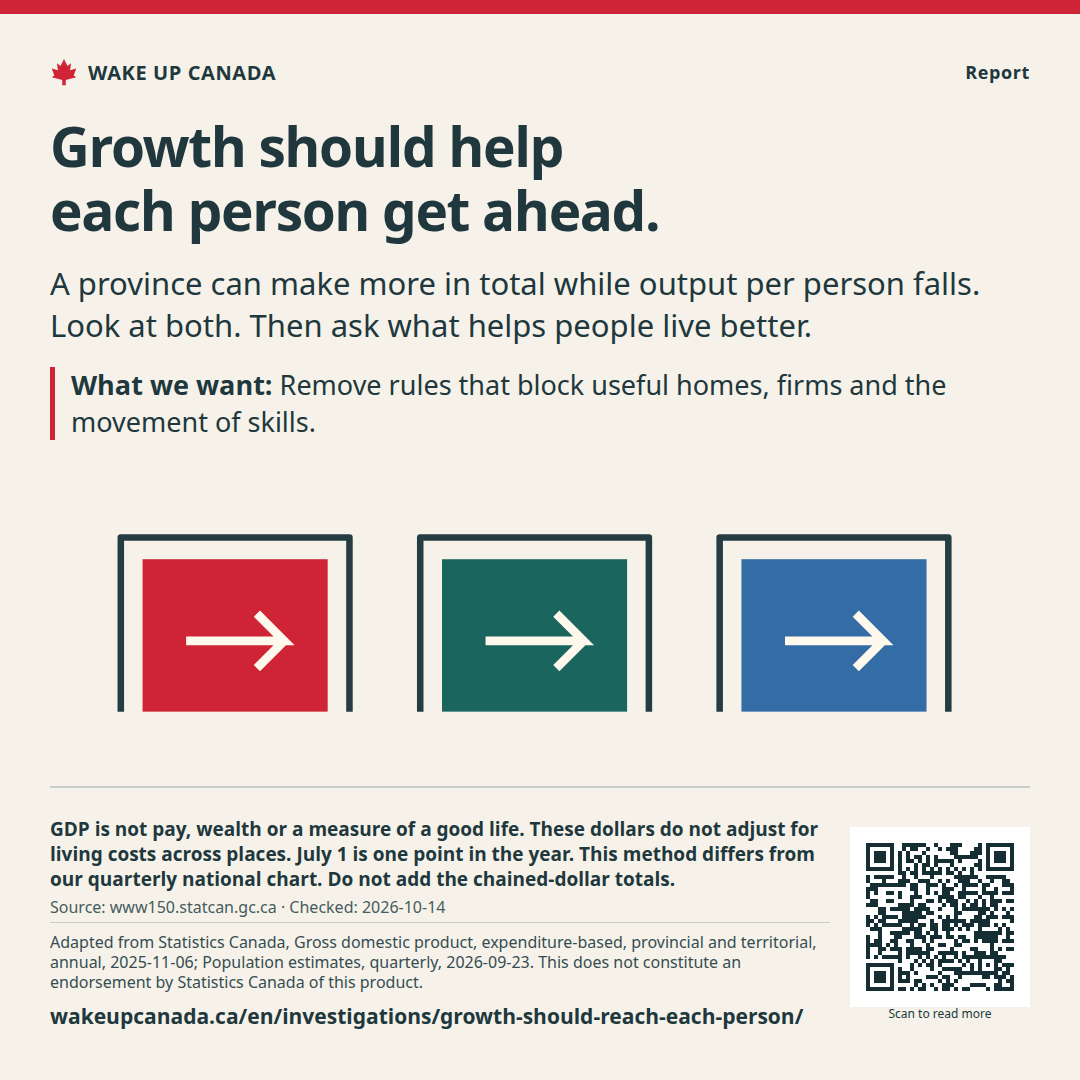
A province can make more in total while output per person falls. Look at both. Then ask what helps people live better.
On this measure, real GDP per person fell in six provinces in 2024. It rose in Newfoundland and Labrador, Prince Edward Island, Nova Scotia and Saskatchewan. The source data ends in 2024. [1][2]
Most of these histories run from 1981 to 2024. Nunavut and the Northwest Territories start as separate GDP series in 1999. The old combined territory stays separate in our chart. [1][2]
Canada needs growth that reaches people. A larger total alone is not enough. Open paths to good work, homes and new firms. Use real GDP per person as one check, alongside pay, costs and time.
More people can help a place grow. But a rise in total GDP does not tell us how much output grew for each person. We divide the real total by the same place’s July 1 population.
GDP counts production, not what each household can spend. A place can rank high because it has large mines or oil fields. That does not prove its renters, workers or small firms are doing well.
[1][2]Allow more homes and shops near jobs. Let workers use their skills across provincial borders. Let new firms find space, power and fair access to finance.
These are our policy asks. The chart does not prove how much each change would add to GDP. Each case needs its own evidence and a clear test of results.
Track pay after price changes, rent and purchase costs, travel time and access to services. Break out results by age and income where sound data exists.
A plan that raises output but leaves many people worse off needs more work. Growth and a good life should be tested together.
GDP per person can move with the business cycle, resource demand and the age mix of a place. Do not blame every fall on a rule or a government. Keep the gains visible too. This chart starts the questions; it does not settle the causes.
[1][2]Remove rules that block useful homes, firms and the movement of skills.
Report real output, pay and living costs beside total growth.
Show the cost of each change and who shares its gains.
Provincial and territorial governments, local councils and federal trade and housing offices.
Price each reform on its own. No national cost or savings total is claimed.
Each chart has its own dates, sources and limits. Open it to see the full data and download the figures.
Growth and wealth
GDP is the value of what a place makes. This chart takes out price changes, then splits that total by the number of people.
2024 · 2017 Canadian dollars per person
See the chart and the case ↗Source title in English
WAKE UP CANADA
Help more people see the facts and the plan.

A province can make more in total while output per person falls. Look at both. Then ask what helps people live better.
Keep the source, date and notes with the image.
Checked:
What this does not show: GDP is not pay, wealth or a measure of a good life. These dollars do not adjust for living costs across places. July 1 is one point in the year. This method differs from our quarterly national chart. Do not add the chained-dollar totals.
No account needed. Sharing does not sign you up for email.

If the image opens in a new tab, press and hold it or use your browser’s save tool.
This supports the whole cause. Emails are a separate choice.
Support totals are not available right now.
Each email counts once per cause. This does not sign a petition. Your name and email stay private. Only the total is public.
Markets & quotas · Report
Better tools can help each hour go further. Open markets and test what helps.
Read the report ↗Markets & quotas · Report
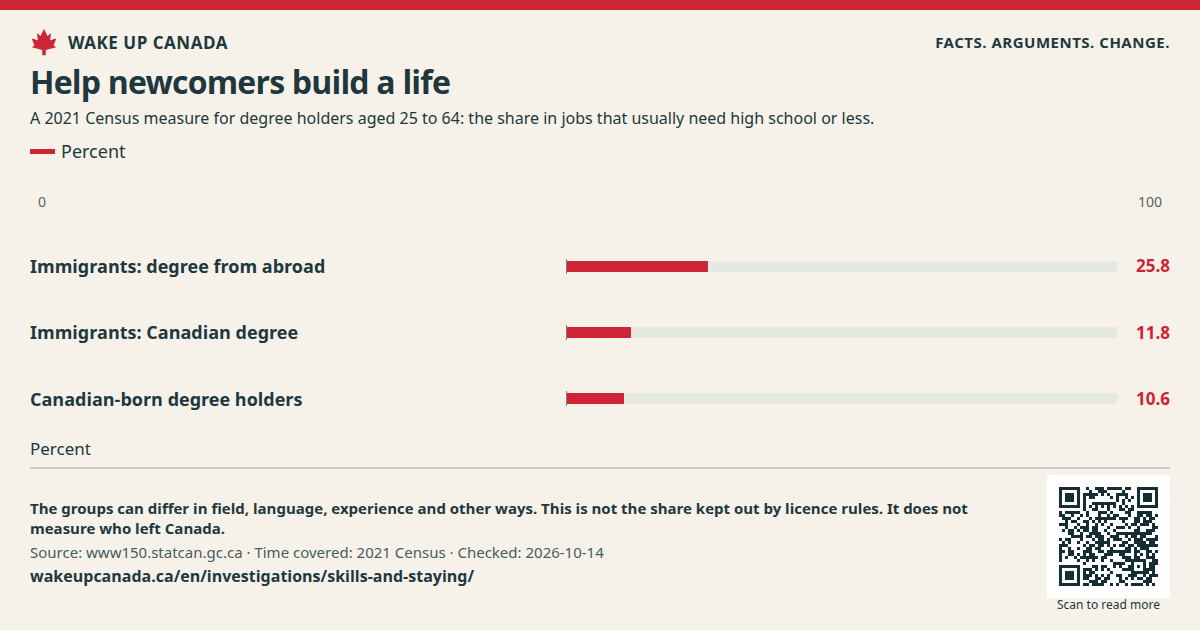
Let people use proven skills and build a life. Track moves without twisting what they mean.
Read the report ↗Markets & quotas · Report
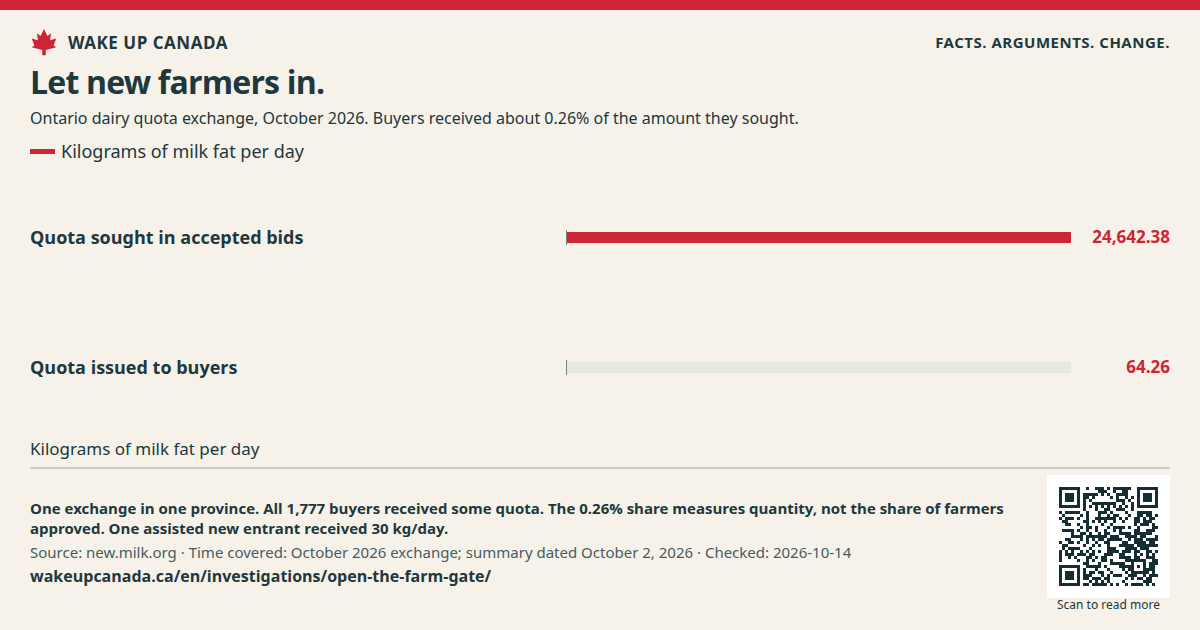
Food must be safe. The right to make it should not be a scarce asset that farmers must buy.
Read the report ↗