A gap in how degrees match work
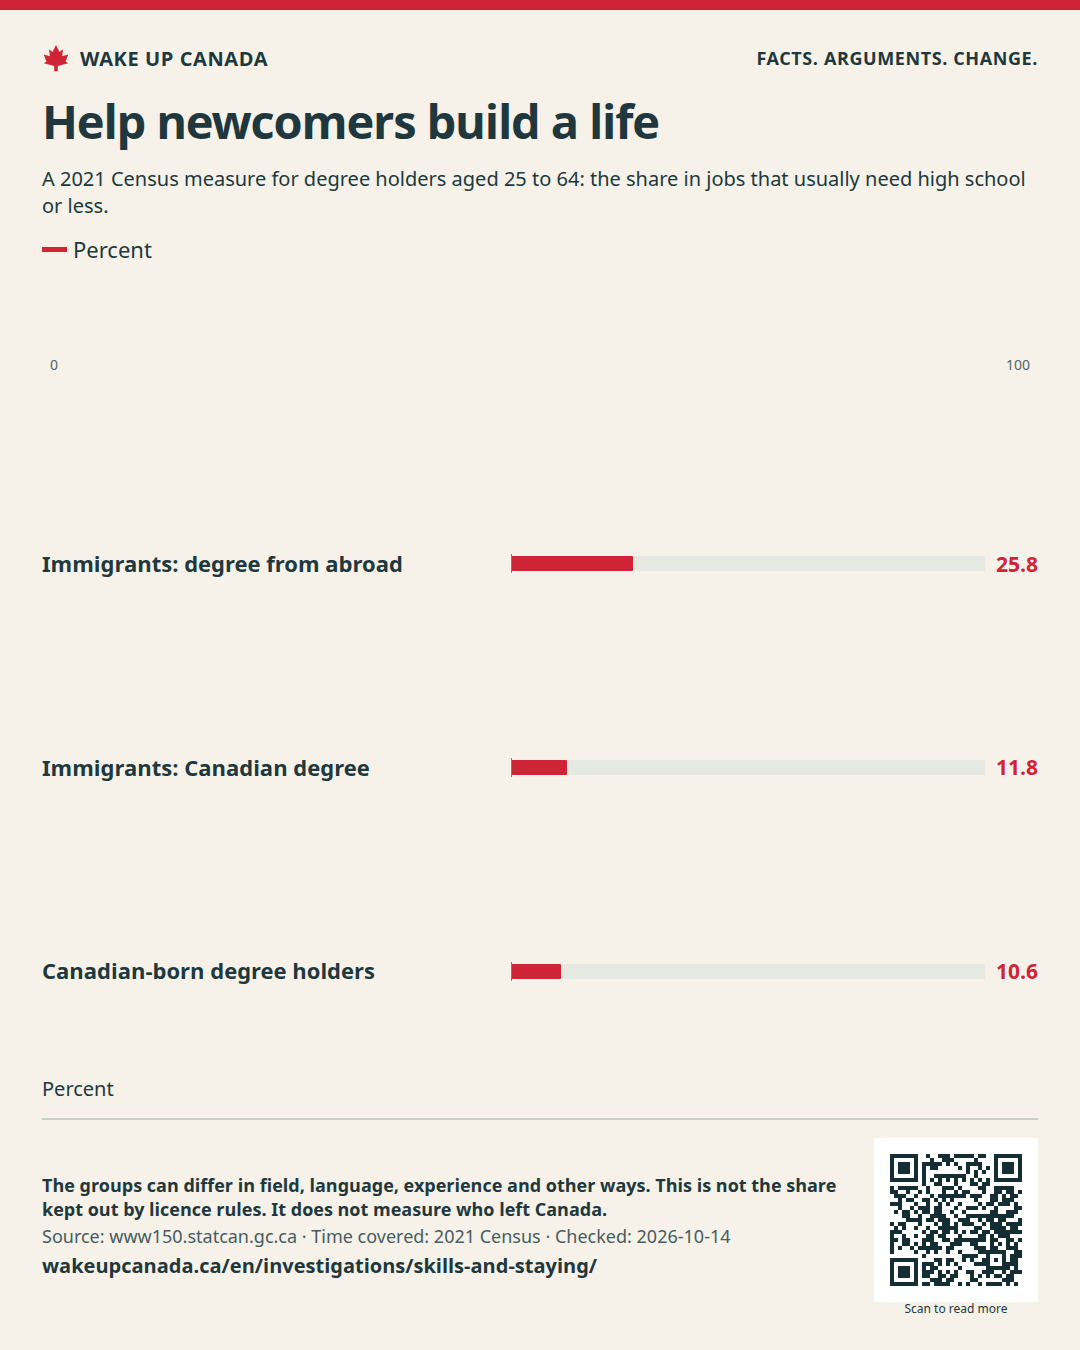
The 2021 job-mismatch rate was 25.8% for immigrants with foreign degrees, against 11.8% for immigrants with Canadian degrees. The measure covers degree holders aged 25 to 64. [1][2]
Report · Published
Let people use proven skills and build a life. Track moves without twisting what they mean.
The 2021 job-mismatch rate was 25.8% for immigrants with foreign degrees, against 11.8% for immigrants with Canadian degrees. The measure covers degree holders aged 25 to 64. [1][2]
Ontario’s five-year same-province rate was 90.8% for the 2018 admission group. New Brunswick’s was 57.6%, up from 47.9% for its 2013 group. [3]
Inviting skilled people is only a start. They need a fair chance to use their skills, find a home and build ties. Our goal is a country people can choose to stay in. It is not to trap anyone in a province or treat every move as a failure.
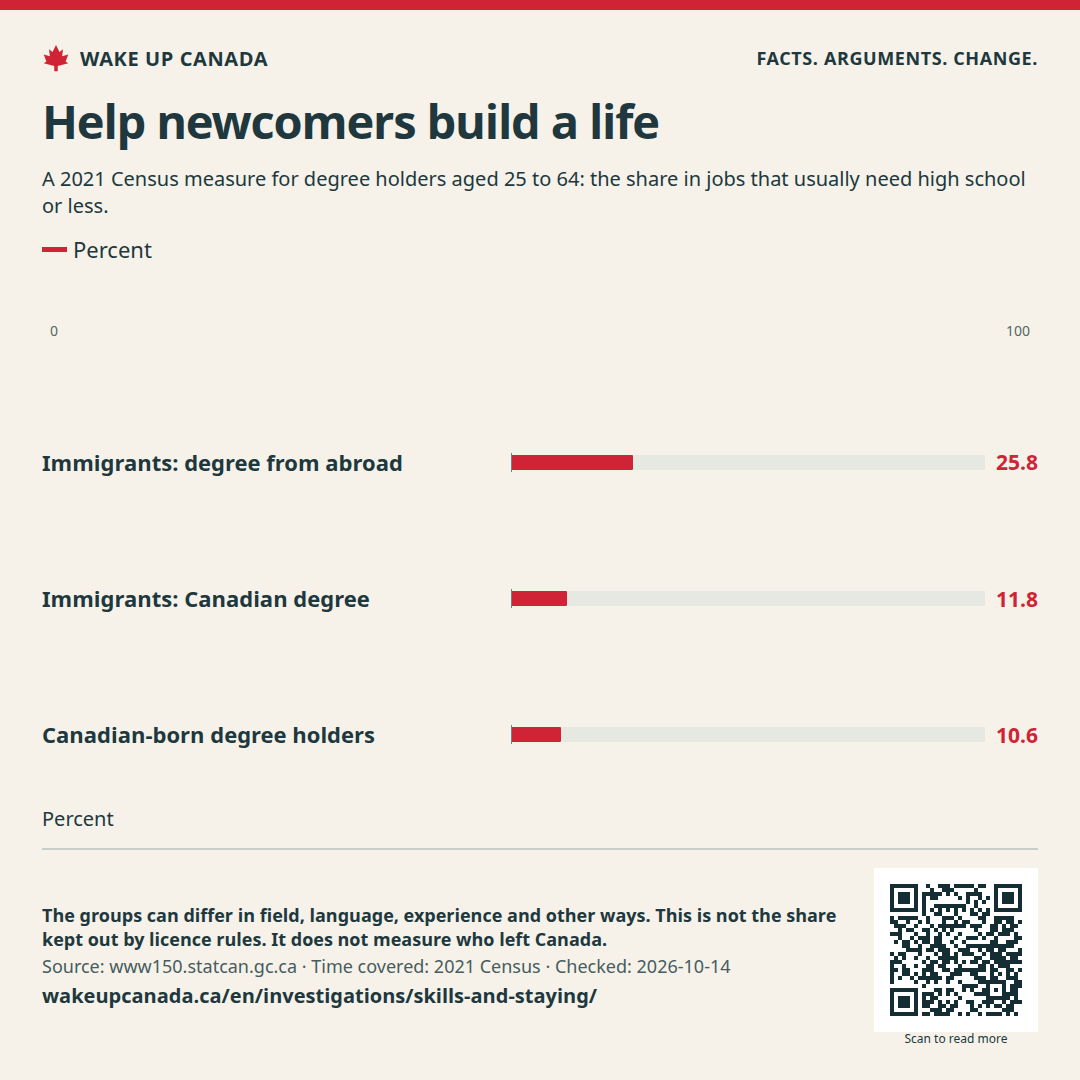
The 2021 Census found a wide gap among degree holders aged 25 to 64. For immigrants with a degree from abroad, the rate of work below their schooling was 25.8%. For immigrants with a Canadian degree, it was 11.8%. This measure counts work that normally needs high school or less. It does not prove that a licence rule caused every mismatch.
[1][2]For people granted permanent status in 2018, Ontario’s five-year rate of staying in the planned province was 90.8%. New Brunswick’s was 57.6%. The source covers immigrant taxfilers. It asks where in Canada they live. It cannot tell us how many left Canada, why they moved, or when they first came here on a temporary permit.
[3]New Brunswick’s rate rose from 47.9% for the 2013 group to 57.6% for the 2018 group. Those checks took place in 2018 and 2023. A separate 2024 study found growing tax filing and work across many entry groups. These findings do not support a simple story that more and more newcomers are leaving. Tax records are clues, not a full count of departures.
[3][4]Keep skill and safety tests that serve a real need. Drop repeat checks when the same skills have been shown. Tell each person what is missing, what it costs and when a decision will come. Give them a fair way to appeal. Pair that work with homes to rent and buy. Ask people why they move, and publish the answers without naming them.
People move for family, school, work and personal choice. Training systems also differ. A lower stay rate is not proof that a place failed, and a foreign degree alone does not prove every job standard is met.
Set clear tests, fees and decision times for each regulated job.
Keep separate measures for moving province, leaving Canada and using skills.
Link settlement plans to homes and jobs, then ask what actually helped.
Provinces, territories and job rule makers set skill tests. Federal and local officials can link homes, jobs and help for newcomers. Statistics Canada can track the results.
No new grant or spending total is proposed. Rule changes and reporting still have admin costs; these have not been costed nationally. Any new public works, grants or guarantees need a separate costed proposal.
A 2021 Census measure for degree holders aged 25 to 64: the share in jobs that usually need high school or less.
Percent · 2021 Census
The groups can differ in field, language, experience and other ways. This is not the share kept out by licence rules. It does not measure who left Canada.
Check the sources: Statistics Canada: foreign-degree overqualification infographic · Statistics Canada: Education, 2021 Census release
Each chart has its own dates, sources and limits. Open it to see the full data and download the figures.
A fair chance
See who still lived in their planned province five years after getting permanent status. This is one part of a much bigger question.
2023 · Percent
See the chart and the case ↗Work and skills
For ages 25 to 54, the share in work is above its level ten years ago. But it is below its 2023 high. See both the long gains and recent strain.
Sep 2026 · Percent
See the chart and the case ↗Source title in English
We credit their work and draw our own conclusions. A link is not an endorsement from them.
WAKE UP CANADA
Help more people see the facts and the plan.
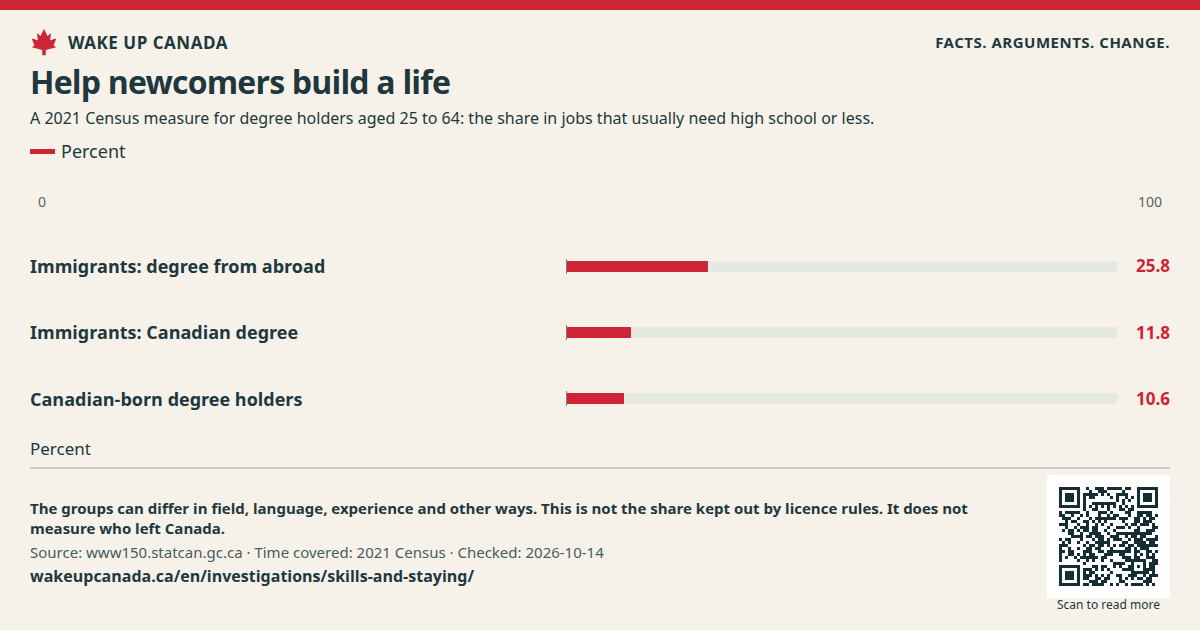
Let people use proven skills and build a life. Track moves without twisting what they mean.
Keep the source, date and notes with the image.
Checked:
What this does not show: These sources cover different years and groups. They cannot show that poor skill use caused a move.
No account needed. Sharing does not sign you up for email.

If the image opens in a new tab, press and hold it or use your browser’s save tool.
This supports the whole cause. Emails are a separate choice.
Support totals are not available right now.
Each email counts once per cause. This does not sign a petition. Your name and email stay private. Only the total is public.
Markets & quotas · Report
Better tools can help each hour go further. Open markets and test what helps.
Read the report ↗Markets & quotas · Report
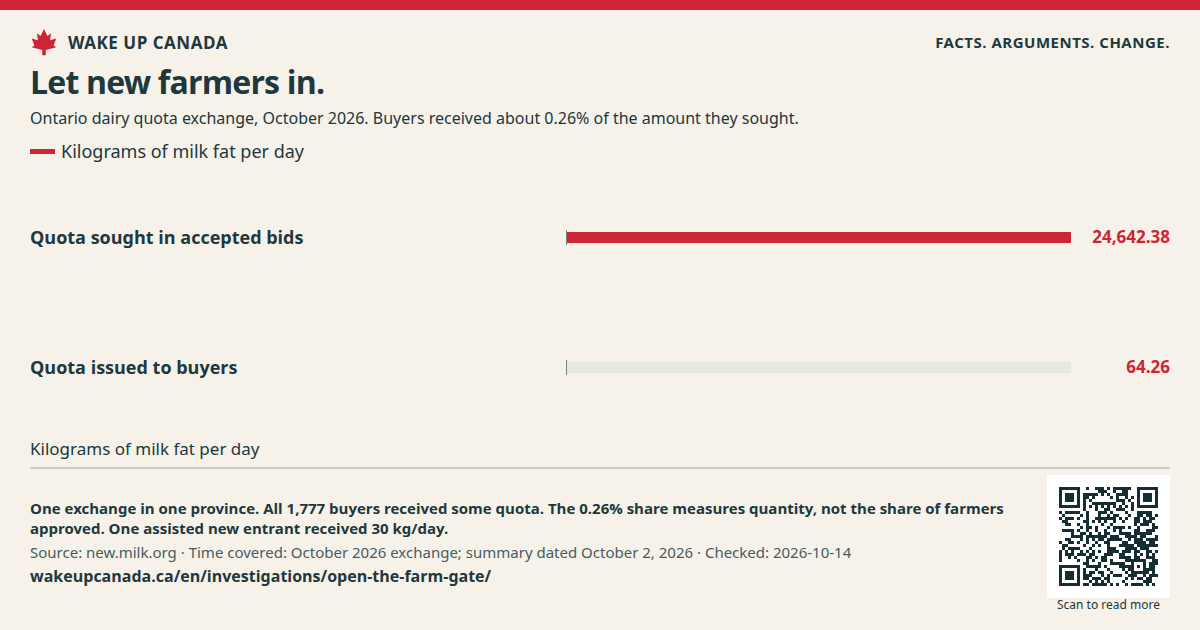
Food must be safe. The right to make it should not be a scarce asset that farmers must buy.
Read the report ↗Markets & quotas · Report
Canada has made new trade deals with itself. Now test the rules that still stand between a seller and a buyer.
Read the report ↗