Why this matters
People should keep more of what they earn. A tax cut needs a clear price and a fair test of who gains.
What we want to change
Make it easier to earn more and keep more. Test each tax cut with clear income and family cases.
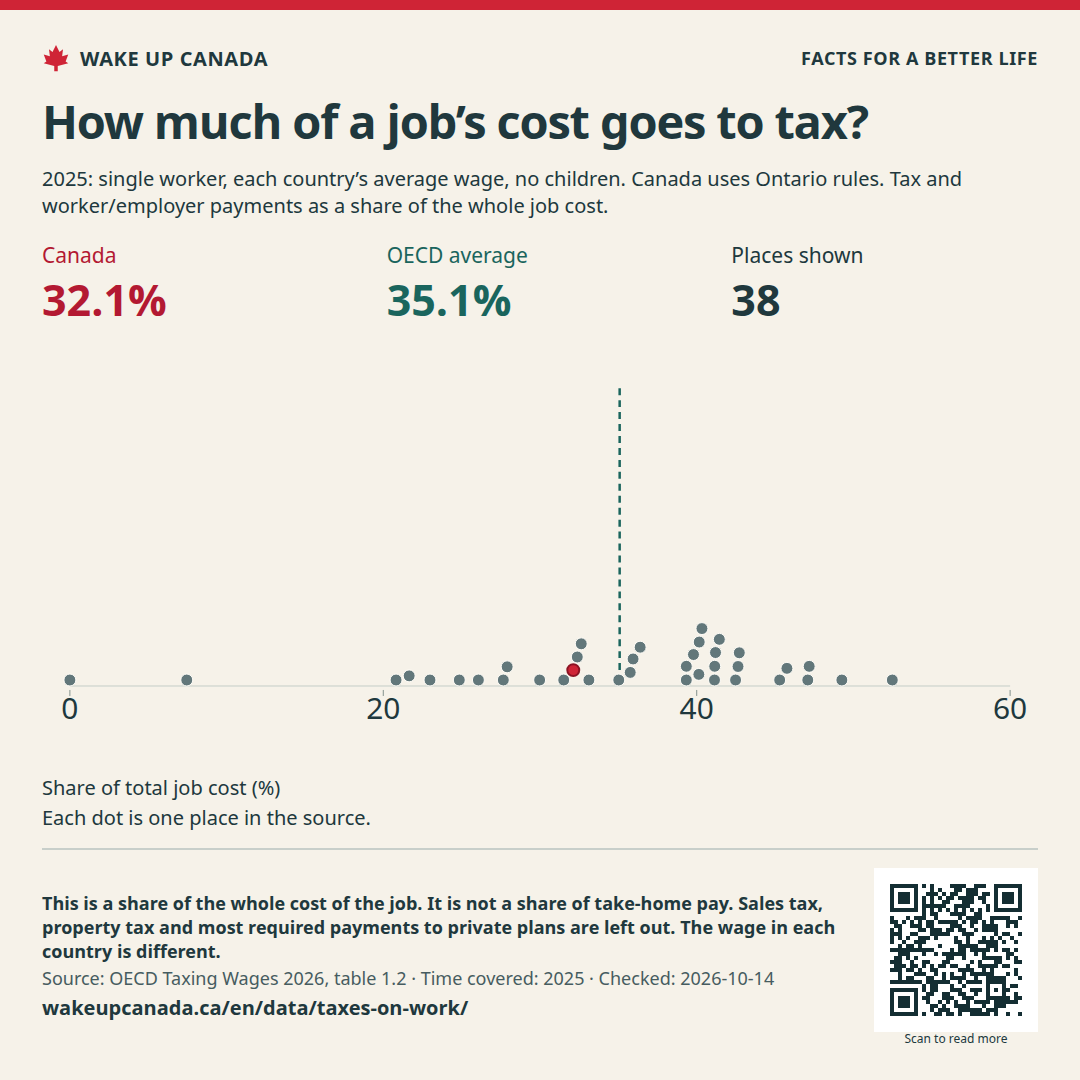
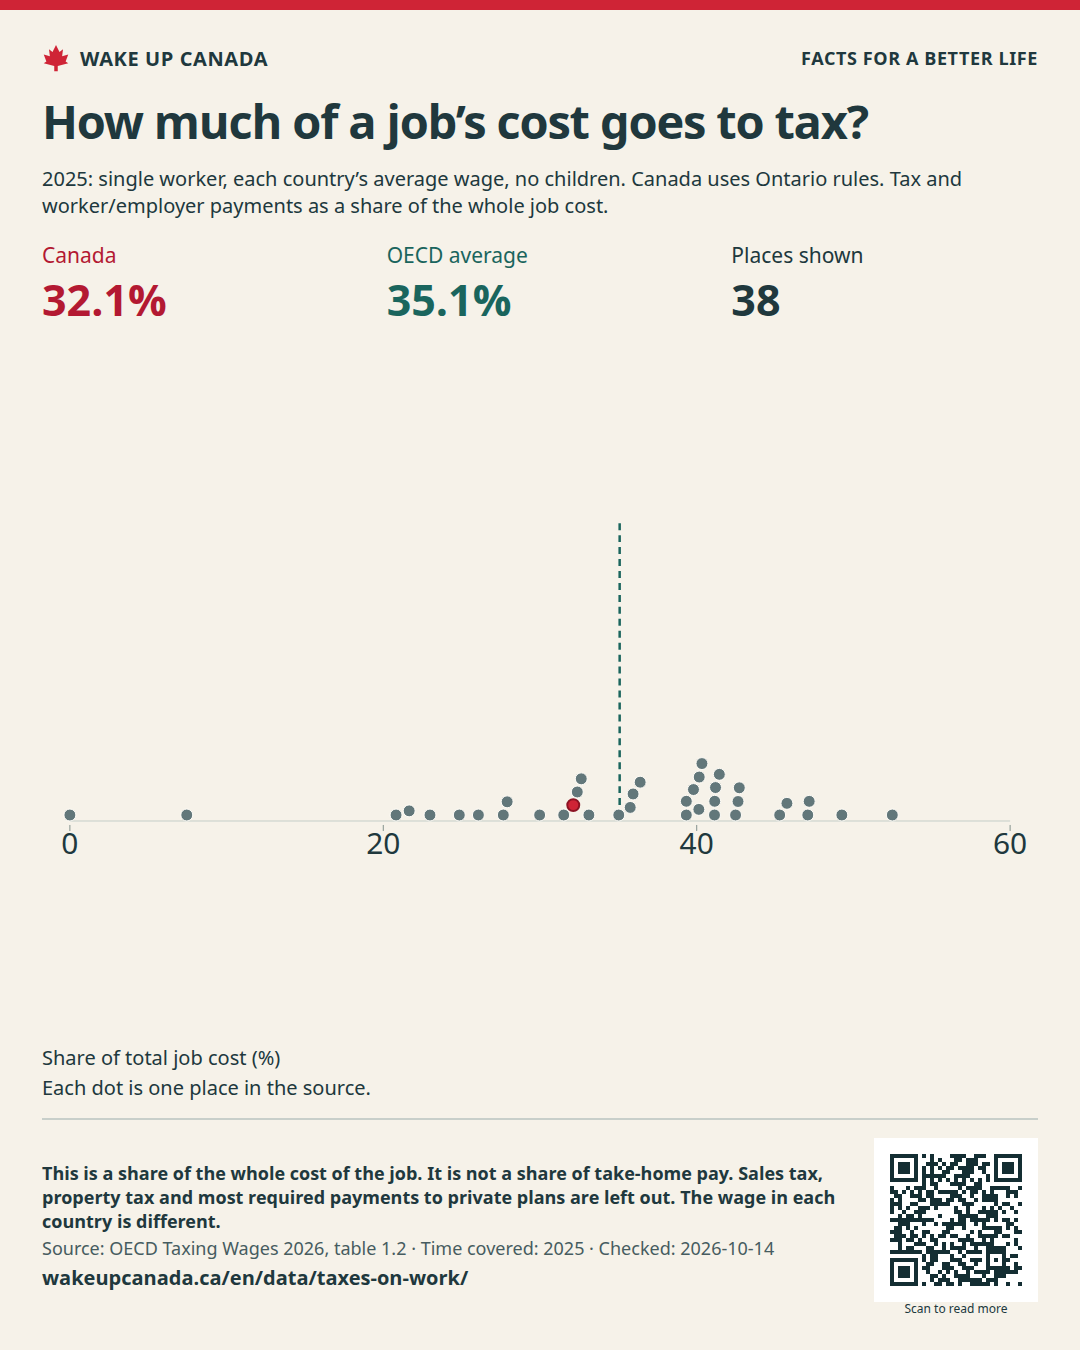
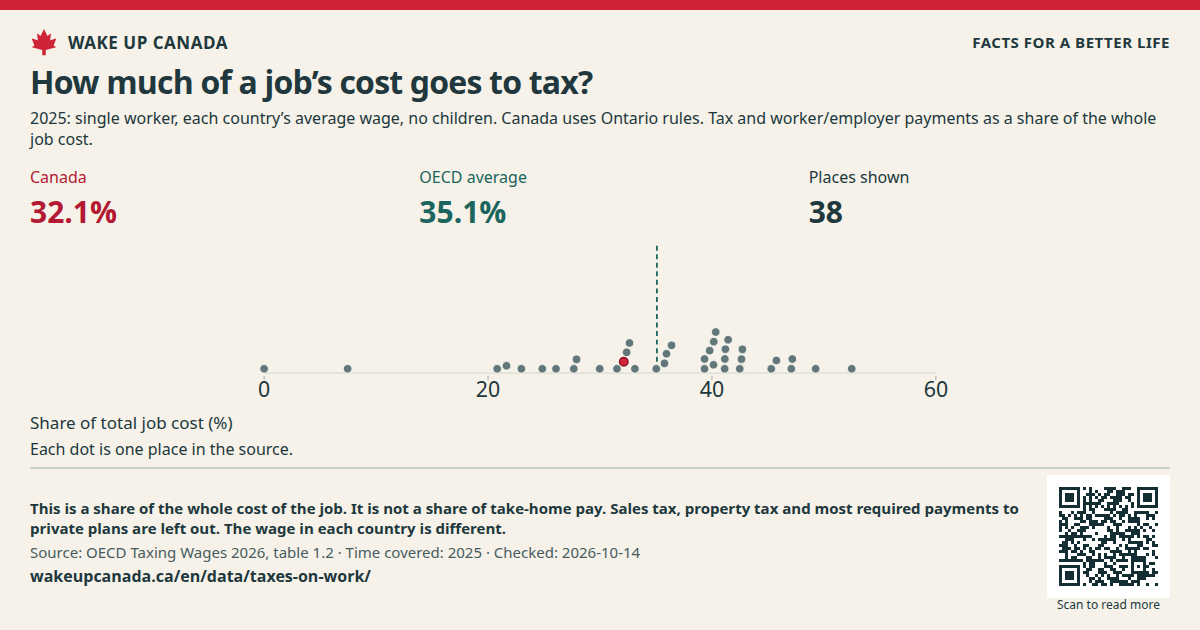
For this single-worker case, Canada’s total is 32.1%. The OECD average is 35.1%. Canada is below that average, but above the US at 30.0%.
Time covered: 2025
Share of total job cost (%)
Each dot is one place in the source.
Shown from low to high · Share of total job cost (%)
This table has the same values as the chart. You can scroll the table sideways.
| Place | Name in the source | Time | Rate |
|---|---|---|---|
| Colombia | Colombia | 2025 | 0 |
| Chile | Chile | 2025 | 7.4585 |
| New Zealand | New Zealand | 2025 | 20.8149 |
| Mexico | Mexico | 2025 | 21.6511 |
| Switzerland | Switzerland | 2025 | 22.9794 |
| South Korea | Korea | 2025 | 24.8496 |
| Israel | Israel | 2025 | 26.0683 |
| Costa Rica | Costa Rica | 2025 | 27.6586 |
| Australia | Australia | 2025 | 27.9043 |
| United States | United States | 2025 | 29.9771 |
| Iceland | Iceland | 2025 | 31.5141 |
| Canada | Canada | 2025 | 32.1229 |
| United Kingdom | United Kingdom | 2025 | 32.3789 |
| Ireland | Ireland | 2025 | 32.6328 |
| Japan | Japan | 2025 | 33.12 |
| Poland | Poland | 2025 | 35.0261 |
| Denmark | Denmark | 2025 | 35.757 |
| Netherlands | Netherlands | 2025 | 35.9393 |
| Norway | Norway | 2025 | 36.3915 |
| Greece | Greece | 2025 | 39.337 |
| Portugal | Portugal | 2025 | 39.3374 |
| Lithuania | Lithuania | 2025 | 39.7942 |
| Latvia | Latvia | 2025 | 40.1368 |
| Luxembourg | Luxembourg | 2025 | 40.1604 |
| Türkiye | Türkiye | 2025 | 40.3343 |
| Sweden | Sweden | 2025 | 41.1358 |
| Hungary | Hungary | 2025 | 41.1504 |
| Czechia | Czechia | 2025 | 41.2002 |
| Spain | Spain | 2025 | 41.4441 |
| Finland | Finland | 2025 | 42.4799 |
| Estonia | Estonia | 2025 | 42.6368 |
| Slovakia | Slovak Republic | 2025 | 42.7183 |
| Slovenia | Slovenia | 2025 | 45.2952 |
| Italy | Italy | 2025 | 45.7574 |
| Austria | Austria | 2025 | 47.0884 |
| France | France | 2025 | 47.1781 |
| Germany | Germany | 2025 | 49.2631 |
| Belgium | Belgium | 2025 | 52.4822 |
| OECD average | OECD Average | 2025 | 35.0835 |
A full set of 38 OECD countries for one single worker in 2025, with Canada and the OECD average marked.
Checked:
People should keep more of what they earn. A tax cut needs a clear price and a fair test of who gains.
Make it easier to earn more and keep more. Test each tax cut with clear income and family cases.
Source released:
WAKE UP CANADA
Help more people see the facts and the plan.
For this single-worker case, Canada’s total is 32.1%. The OECD average is 35.1%. Canada is below that average, but above the US at 30.0%.
Keep the source, date and notes with the image.
Checked:
What this does not show: This is a share of the whole cost of the job. It is not a share of take-home pay. Sales tax, property tax and most required payments to private plans are left out. The wage in each country is different.
No account needed. Sharing does not sign you up for email.

If the image opens in a new tab, press and hold it or use your browser’s save tool.