Public debt: count the assets too

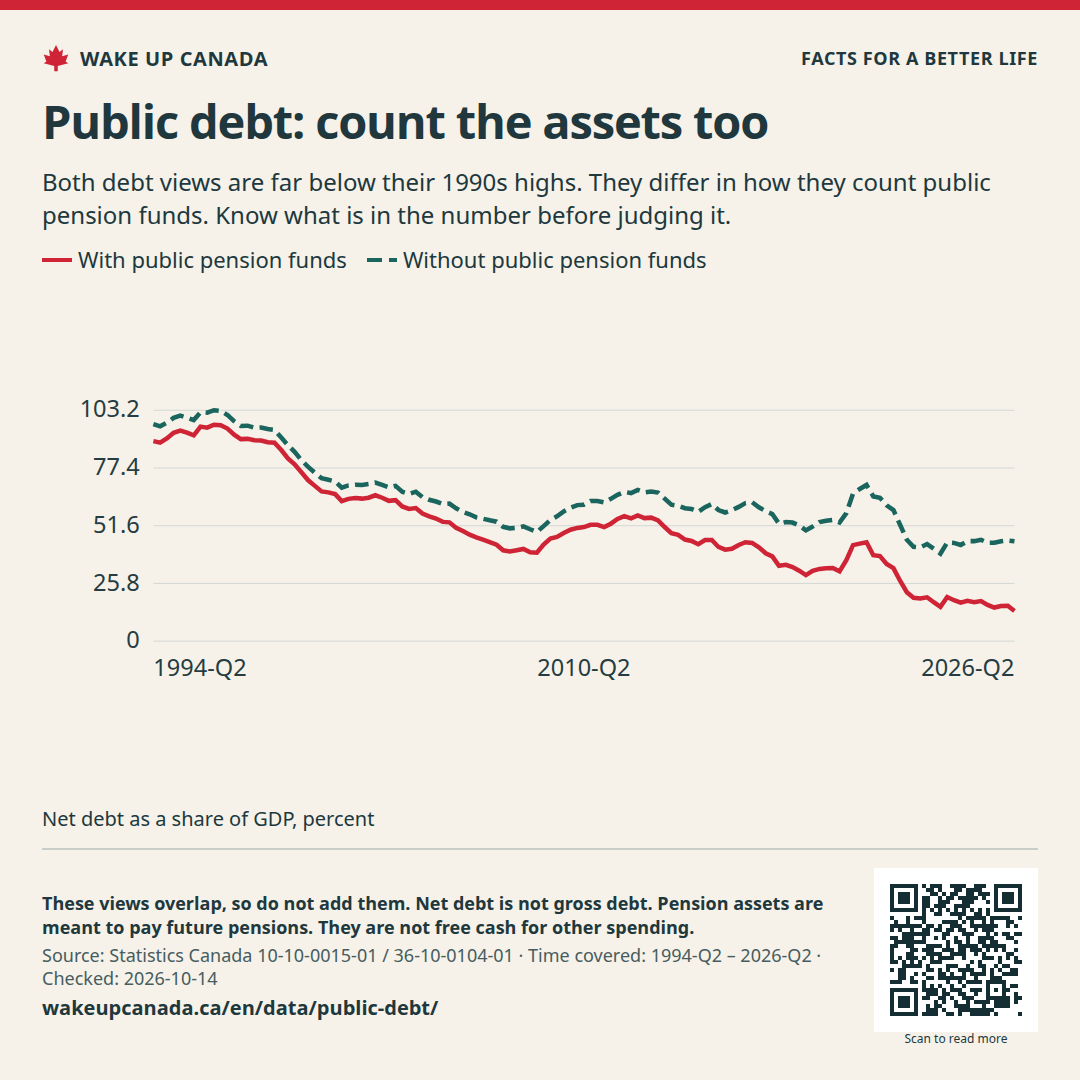
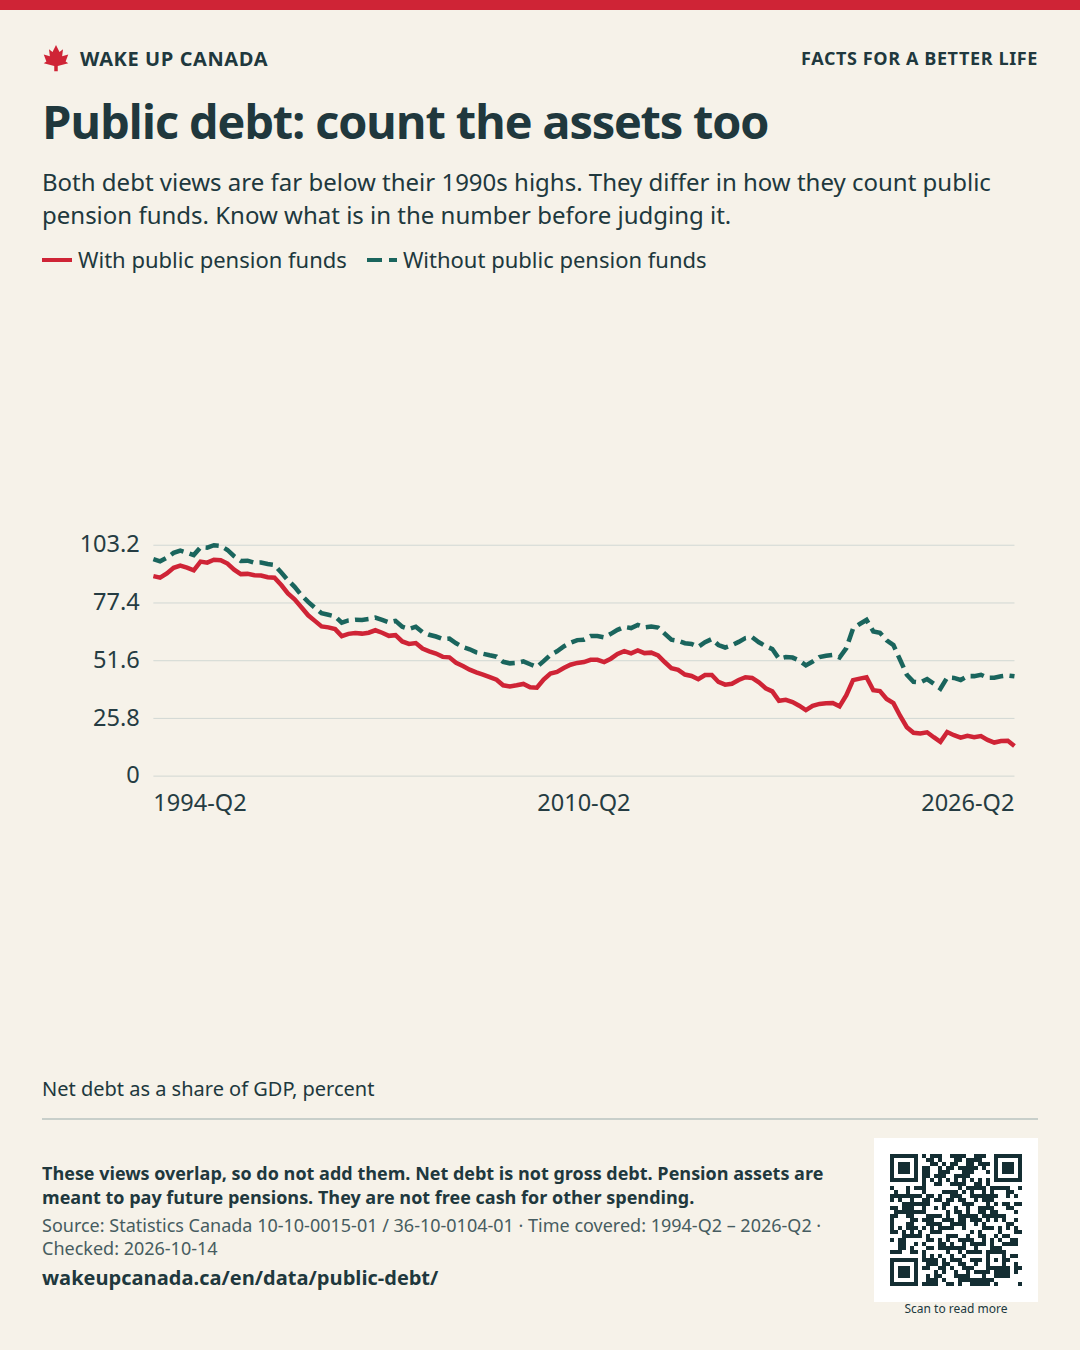
Both debt views are far below their 1990s highs. They differ in how they count public pension funds. Know what is in the number before judging it.

Two views of net public debt, since 1994

Time covered: 1994 · Quarter 2 — 2026 · Quarter 2

Showing: 1994 · Quarter 2 — 2026 · Quarter 2

With public pension funds

13.5Last point · Net debt as a share of GDP, percent

Change over 10 years: -30.7 percentage points2016 · Quarter 2 → 2026 · Quarter 2

Without public pension funds

44.6Last point · Net debt as a share of GDP, percent

Change over 10 years: -17.1 percentage points2016 · Quarter 2 → 2026 · Quarter 2

  • With public pension funds 13.5
  • Without public pension funds 44.6
1994 · Quarter 22026 · Quarter 2

Net debt as a share of GDP, percent

A change from 6% to 7% is one percentage point.

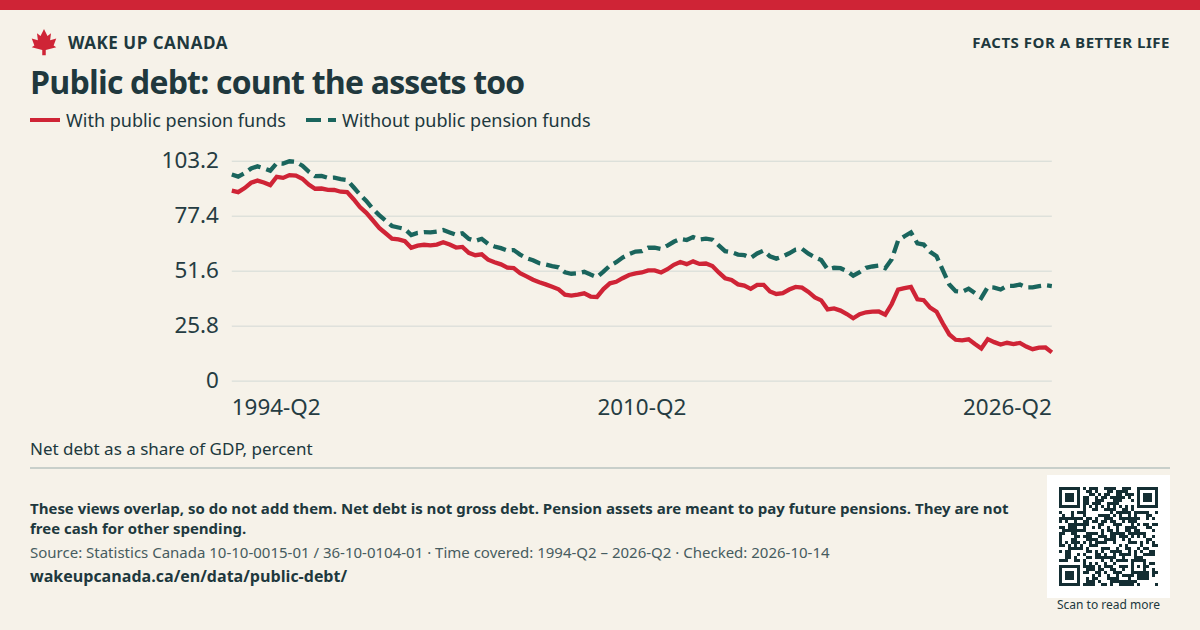
Two lines show net government debt as a share of GDP from 1994. One includes public pension funds. The other leaves them out.

Dated release · Checked:

See all the data

This table has the same values as the chart. You can scroll the table sideways.

Two views of net public debt, since 1994 · Net debt as a share of GDP, percent
TimeWith public pension fundsWithout public pension funds
1994 · Quarter 289.4%97%
1994 · Quarter 388.7%96%
1994 · Quarter 490.6%97.6%
1995 · Quarter 193.1%99.8%
1995 · Quarter 294.1%100.8%
1995 · Quarter 393.2%99.9%
1995 · Quarter 492%98.8%
1996 · Quarter 195.9%102.3%
1996 · Quarter 295.4%102.1%
1996 · Quarter 396.7%103.2%
1996 · Quarter 496.5%102.9%
1997 · Quarter 195%101.1%
1997 · Quarter 292.3%98.3%
1997 · Quarter 390.3%96.2%
1997 · Quarter 490.4%96.3%
1998 · Quarter 189.8%95.4%
1998 · Quarter 289.7%95.5%
1998 · Quarter 388.9%94.8%
1998 · Quarter 488.7%94.4%
1999 · Quarter 185.4%91%
1999 · Quarter 281.7%87.6%
1999 · Quarter 379%84.6%
1999 · Quarter 475.5%80.9%
2000 · Quarter 171.9%77.9%
2000 · Quarter 269.4%75.3%
2000 · Quarter 366.9%72.8%
2000 · Quarter 466.5%72.1%
2001 · Quarter 165.7%71.4%
2001 · Quarter 262.6%68.6%
2001 · Quarter 363.6%69.6%
2001 · Quarter 464%69.9%
2002 · Quarter 163.7%69.8%
2002 · Quarter 264.1%70.2%
2002 · Quarter 365.2%70.9%
2002 · Quarter 464.1%69.8%
2003 · Quarter 162.7%68.7%
2003 · Quarter 263%69.4%
2003 · Quarter 360.2%66.8%
2003 · Quarter 459.1%65.8%
2004 · Quarter 159.5%66.8%
2004 · Quarter 257%64.4%
2004 · Quarter 355.8%63.2%
2004 · Quarter 454.8%62.4%
2005 · Quarter 153.3%61.3%
2005 · Quarter 253.1%61.5%
2005 · Quarter 350.7%59.4%
2005 · Quarter 449.2%57.7%
2006 · Quarter 147.6%56.7%
2006 · Quarter 246.4%55.3%
2006 · Quarter 345.4%54.7%
2006 · Quarter 444.3%54%
2007 · Quarter 143.1%53.4%
2007 · Quarter 240.6%51.1%
2007 · Quarter 340.1%50.4%
2007 · Quarter 440.6%50.6%
2008 · Quarter 141.2%51.3%
2008 · Quarter 239.7%50%
2008 · Quarter 339.5%48.8%
2008 · Quarter 443.2%51.4%
2009 · Quarter 145.9%54.2%
2009 · Quarter 246.6%55.8%
2009 · Quarter 348.3%58%
2009 · Quarter 449.8%59.6%
2010 · Quarter 150.6%60.8%
2010 · Quarter 251%61%
2010 · Quarter 352%62.6%
2010 · Quarter 452%62.6%
2011 · Quarter 151%62%
2011 · Quarter 252.5%63.6%
2011 · Quarter 354.6%65.4%
2011 · Quarter 455.9%66.7%
2012 · Quarter 154.9%66.2%
2012 · Quarter 256.2%67.6%
2012 · Quarter 355%66.5%
2012 · Quarter 455.2%66.9%
2013 · Quarter 154%66.4%
2013 · Quarter 251%63.7%
2013 · Quarter 348.3%61%
2013 · Quarter 447.5%60.5%
2014 · Quarter 145.4%59.4%
2014 · Quarter 244.8%59.1%
2014 · Quarter 343.3%57.8%
2014 · Quarter 445.2%59.9%
2015 · Quarter 145.2%61.3%
2015 · Quarter 242.1%58.6%
2015 · Quarter 340.9%57.5%
2015 · Quarter 441.3%58.5%
2016 · Quarter 143%60%
2016 · Quarter 244.2%61.7%
2016 · Quarter 343.9%62.1%
2016 · Quarter 441.9%59.8%
2017 · Quarter 139.3%58.1%
2017 · Quarter 237.9%56.8%
2017 · Quarter 333.7%52.5%
2017 · Quarter 434.1%53.2%
2018 · Quarter 133.1%53%
2018 · Quarter 231.5%51.7%
2018 · Quarter 329.5%49.5%
2018 · Quarter 431.4%51.2%
2019 · Quarter 132.3%53.2%
2019 · Quarter 232.6%53.8%
2019 · Quarter 332.7%54.2%
2019 · Quarter 431.2%53%
2020 · Quarter 136.2%57.2%
2020 · Quarter 242.9%66%
2020 · Quarter 343.6%68%
2020 · Quarter 444.2%69.8%
2021 · Quarter 138.4%64.7%
2021 · Quarter 238%64.1%
2021 · Quarter 334.5%60.7%
2021 · Quarter 432.6%58.6%
2022 · Quarter 126.9%51.9%
2022 · Quarter 221.9%45.3%
2022 · Quarter 319.4%42.2%
2022 · Quarter 419.1%41.9%
2023 · Quarter 119.6%43.4%
2023 · Quarter 217.4%41.3%
2023 · Quarter 315.3%39.1%
2023 · Quarter 419.7%44.1%
2024 · Quarter 118.3%43.9%
2024 · Quarter 217.2%43%
2024 · Quarter 318%44.7%
2024 · Quarter 417.4%44.7%
2025 · Quarter 117.9%45.3%
2025 · Quarter 216.2%44%
2025 · Quarter 315%44%
2025 · Quarter 415.7%44.6%
2026 · Quarter 115.8%45%
2026 · Quarter 213.5%44.6%
Download the data (CSV) ↓

Why this matters

Past gains show that change is possible. We still need honest costs and clear results from public spending. People should know what their money buys and who will pay future bills.

What we want to change

Show full public costs and service results. Fund useful work and stop programmes that do not deliver.

Back a plan for change

Sources

  1. Statistics Canada · 10-10-0015-01 / 36-10-0104-01 ↗

    Source released:

WAKE UP CANADA

Share the case for change

Help more people see the facts and the plan.

Public debt: count the assets too

Both debt views are far below their 1990s highs. They differ in how they count public pension funds. Know what is in the number before judging it.

Keep the source, date and notes with the image.

Checked:

What this does not show: These views overlap, so do not add them. Net debt is not gross debt. Pension assets are meant to pay future pensions. They are not free cash for other spending.
wakeupcanada.ca/en/data/public-debt/
Scan to open this page
Scan this code to read the full case.

Save an image

If the image opens in a new tab, press and hold it or use your browser’s save tool.

Sources and notes