Use the date on the numbers.
The metro GDP source runs to 2022. Toronto made $522.379 billion in that year; Montréal made $279.501 billion. These are totals at that year’s prices, not real growth or amounts per person. [1]
Report · Published
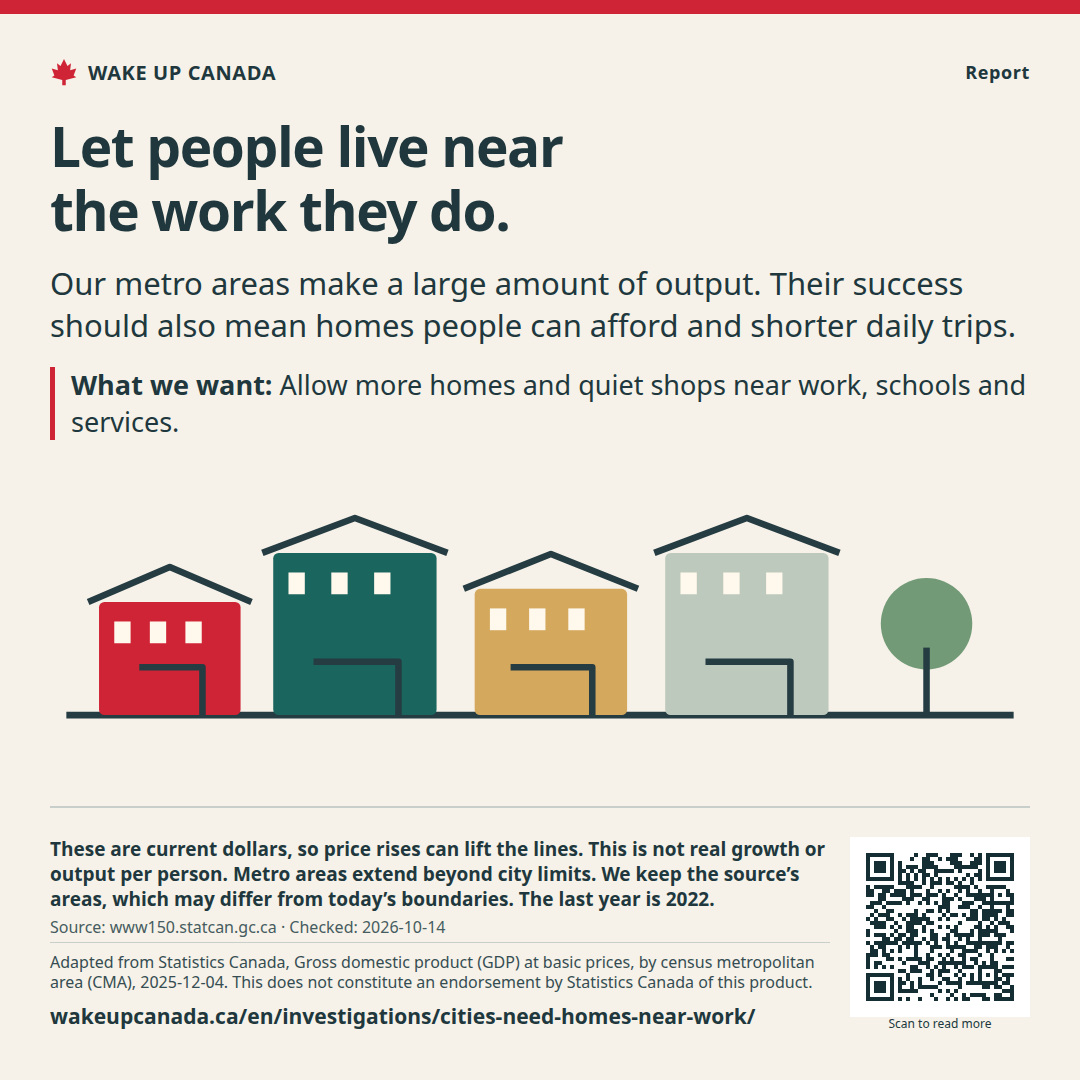
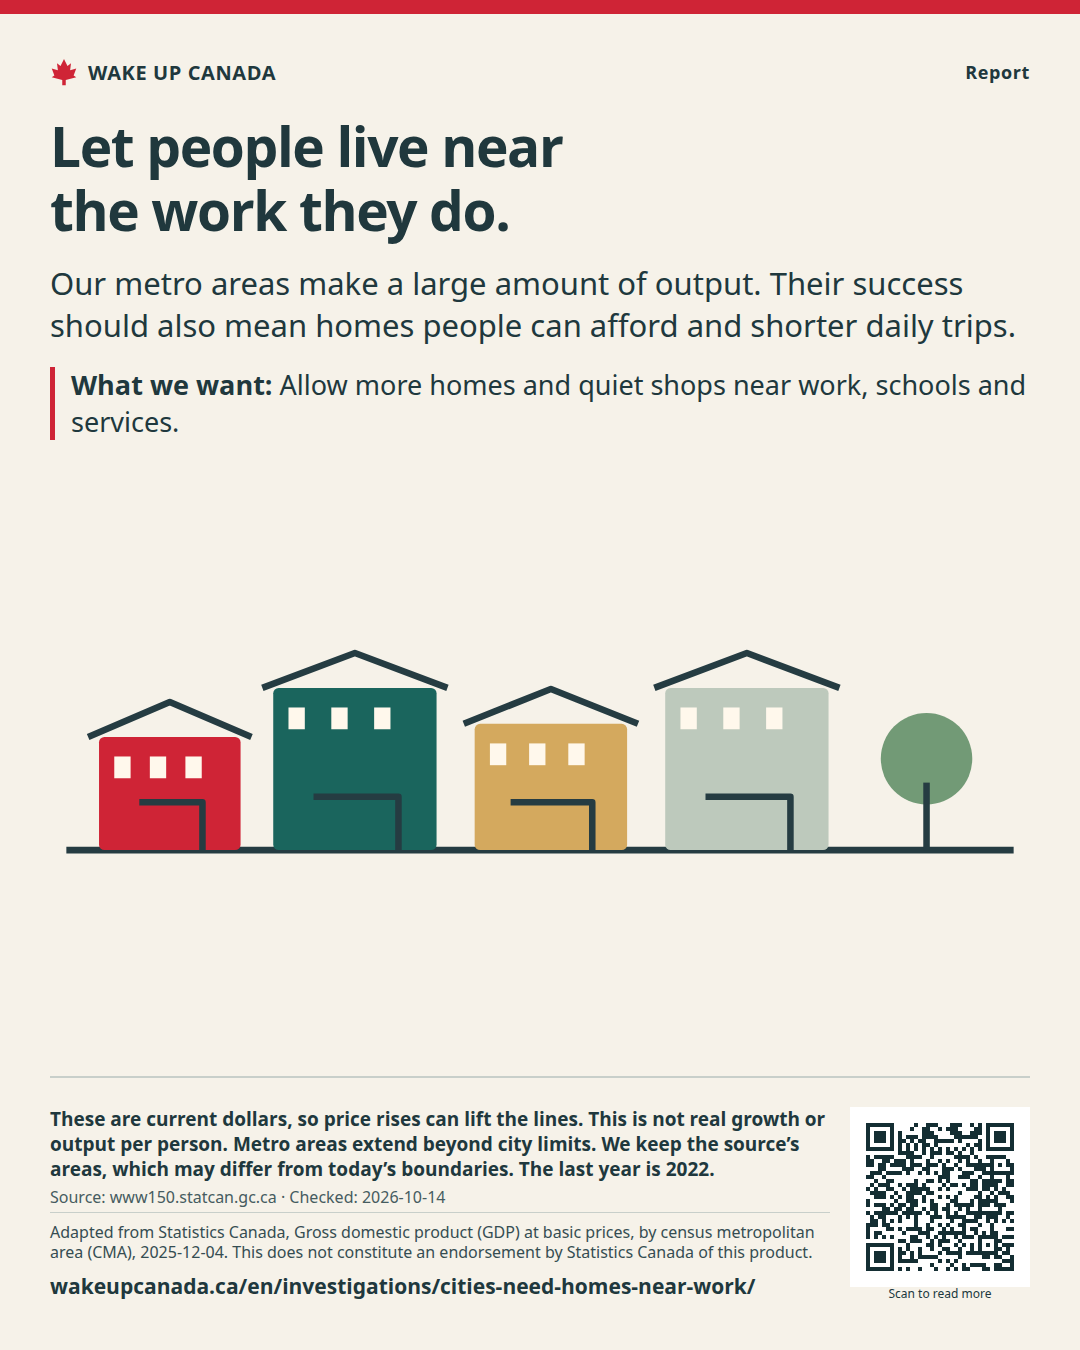
Our metro areas make a large amount of output. Their success should also mean homes people can afford and shorter daily trips.
The metro GDP source runs to 2022. Toronto made $522.379 billion in that year; Montréal made $279.501 billion. These are totals at that year’s prices, not real growth or amounts per person. [1]
Our history includes all 41 metro areas in the table. Six begin in 2021. Ottawa–Gatineau adds its Ontario and Quebec parts once each. [1]
A city is a place to live, not just a GDP total. Allow homes to rent and buy near jobs, shops and schools. Give small homes, flats and quiet local firms a fair place on the same street.
A metro area includes nearby towns linked to a city. It can cross city limits and, for Ottawa–Gatineau, a provincial border. Its GDP does not belong to one local council.
We keep the source’s areas and dates. We do not divide these totals by a city population with different borders. That would make a false figure per person.
[1]Let homes and useful local shops share a street. Put homes near work and services. Plan safe walking routes, bike links and public transit as well as roads.
Keep both rent and ownership in view. More units matter, but people also need fair paths to own a home and build wealth. A low purchase price far from daily needs is not the whole cost of life.
Track rents, purchase prices, travel time and the cost to run streets and pipes. Show who can stay as the area grows. Ask people with low incomes and disabled people whether access improves.
A small town can use these ideas in its own way. The goal is an easier life, not making every place look the same.
Higher nominal GDP can reflect higher prices. It can also go with costly housing and long trips. The chart does not prove that zoning caused its path. A sound reform case needs land-use, housing and travel evidence as well.
[1]Allow more homes and quiet shops near work, schools and services.
Make walking, rolling, cycling and transit safe and useful.
Publish housing costs, travel time and access beside GDP.
Local councils, provinces, territories and federal housing and transport offices.
Street, transit and service work need local budgets. Include upkeep. No total saving is claimed.
Each chart has its own dates, sources and limits. Open it to see the full data and download the figures.
Homes and places
Cities bring jobs and firms close together. See the output of each metro area over time, with the age of the data shown clearly.
2022 · Billions of current Canadian dollars, basic prices
See the chart and the case ↗Source title in English
WAKE UP CANADA
Help more people see the facts and the plan.

Our metro areas make a large amount of output. Their success should also mean homes people can afford and shorter daily trips.
Keep the source, date and notes with the image.
Checked:
What this does not show: These are current dollars, so price rises can lift the lines. This is not real growth or output per person. Metro areas extend beyond city limits. We keep the source’s areas, which may differ from today’s boundaries. The last year is 2022.
No account needed. Sharing does not sign you up for email.

If the image opens in a new tab, press and hold it or use your browser’s save tool.
This supports the whole cause. Emails are a separate choice.
Support totals are not available right now.
Each email counts once per cause. This does not sign a petition. Your name and email stay private. Only the total is public.
Homes & neighbourhoods · Report
Open the door to useful homes, short trips and more choice. Keep the housing evidence honest.
Read the report ↗Homes & neighbourhoods · Report
Build good homes to rent and a fair path to own. Count the full cost and the risks.
Read the report ↗Homes & neighbourhoods · Report
More homes matter. So do shops, safe streets and places to meet. Build places where daily life takes less travel.
Read the report ↗