Canada is not worst on every tax test
In the OECD’s 2025 single-worker case, Canada’s tax wedge is 32.1%, below the OECD average of 35.1%. The US is at 30.0%. This counts part of the cost paid by the employer as well as the worker. [1]
Report · Published
Lower taxes at every level. Compare clear family cases and show how to pay for each cut.
In the OECD’s 2025 single-worker case, Canada’s tax wedge is 32.1%, below the OECD average of 35.1%. The US is at 30.0%. This counts part of the cost paid by the employer as well as the worker. [1]
BC’s Budget 2026 model compares the same family across ten provinces. For a family earning $100,000, selected taxes range from $11,212 in BC to $18,563 in Nova Scotia. The chart shows all ten provinces and the limits of this case. [2]
People should keep more of what they earn. We want lower taxes in Ottawa, each province and each town. Start with taxes that make work and new homes cost more. A good plan tells people what falls, who gains and how to pay for it.
We want low taxes. That is our goal, not a claim that Canada tops every tax chart. People should have more room to save, buy a home, start a firm or take a better job. Show each cut on its own terms. Do not hide its cost or promise a growth gain that has not been proved.
The OECD worker earns the average wage in each country and has no children. The Canadian case uses Ontario’s tax rules. The measure counts income tax and payments by both the worker and employer. It leaves out sales tax, property tax and most required payments to private plans. It is not the share of take-home pay lost to tax.
Family type matters. For a married couple with two children and one average wage, Canada’s result is 22.1%. The OECD average is 26.2%. The same country can give very different results for different families.
[1]The province chart uses a family with two adults earning $60,000 and $40,000. Their children are five and seven. The family saves 10% of its income. BC’s model counts income, sales and fuel taxes, less listed credits and provincial child payments.
This is a February 2026 model. Other provinces’ policy choices were frozen at February 1. The model leaves out property tax, CPP, QPP, EI and employer payroll tax. It does not take off federal child benefits. Quebec’s federal tax break is placed in its provincial column. A different pay split or spending pattern will change the answer.
[2]Local tax bills matter. But a low property tax rate does not always mean a low bill. Home values and the services paid from that tax vary. A fair city comparison must show the full bill, the home it applies to and the fees left out. We have not yet built that national comparison.
Statistics Canada can compare combined province and local government accounts. That helps show public finances. It does not tell a household what it will pay in one town.
[3]We also support a basic income. That goal and lower taxes need one clear budget. Show the payment, the benefits it replaces, who gets more and who pays more. A plan that cuts tax in one place and raises it in another must show both sides.
Build Canada’s tax memo argues for letting people keep more. We agree with that goal. We still need a full check of the cost, funding and effect on each group.
[4]Taxes pay for services people need. A cut that leaves a larger fee or debt bill may not help. Show the trade-offs. Keep evidence that challenges our view on the page.
Set out cuts at every level, with a clear cost and funding plan.
Use the same income, ages and pay split. Count tax, fees and lost benefits.
Show what people kept, what services cost and whether the promised savings were real.
Ottawa, provinces, territories and local councils each set parts of the tax bill. They need to show their own costs and the full effect on people.
No rate cut or total cost has been set. Each plan must show lost tax revenue, costs and funding. Savings from reforms must be checked. Hoped-for growth is not cash already in hand.
Each chart has its own dates, sources and limits. Open it to see the full data and download the figures.
Taxes and public money
Canada: 32.1%Places shown: 38
For this single-worker case, Canada’s total is 32.1%. The OECD average is 35.1%. Canada is below that average, but above the US at 30.0%.
2025 · Share of total job cost (%)
See the chart and the case ↗Taxes and public money
This case has two adults and two children. The adults earn $60,000 and $40,000. Compare the same family across all ten provinces.
As of: Feb 17, 2026 · Selected taxes per year (C$)
See the chart and the case ↗Taxes and public money
Canada: 34.8%Places shown: 38
In 2023, Canada’s taxes were worth 34.8% of GDP. The OECD average was 33.7%. This view uses the same year for all 38 countries.
2023 · Net debt as a share of GDP, percent
See the chart and the case ↗Source title in English
We credit their work and draw our own conclusions. A link is not an endorsement from them.
WAKE UP CANADA
Help more people see the facts and the plan.
Lower taxes at every level. Compare clear family cases and show how to pay for each cut.
Keep the source, date and notes with the image.
Checked:
What this does not show: The charts show fixed tax cases and dated models. They are not a tax quote for your family or proof that a tax cut will pay for itself.
No account needed. Sharing does not sign you up for email.

If the image opens in a new tab, press and hold it or use your browser’s save tool.
This supports the whole cause. Emails are a separate choice.
Support totals are not available right now.
Each email counts once per cause. This does not sign a petition. Your name and email stay private. Only the total is public.
Government that works · Report
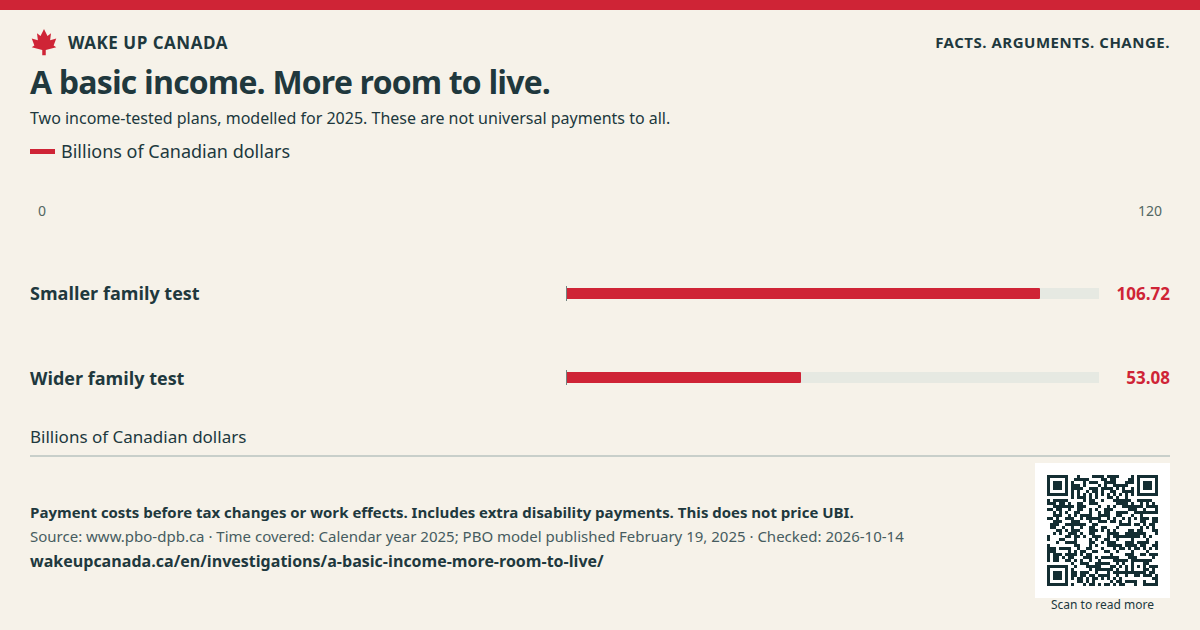
We support universal basic income. The next job is to build it well, fund the tests and show the whole bill.
Read the report ↗Government that works · Report
Lower the tax cost of starting and growing a firm. Judge the whole set of rules, not one rate.
Read the report ↗Homes & neighbourhoods · Report
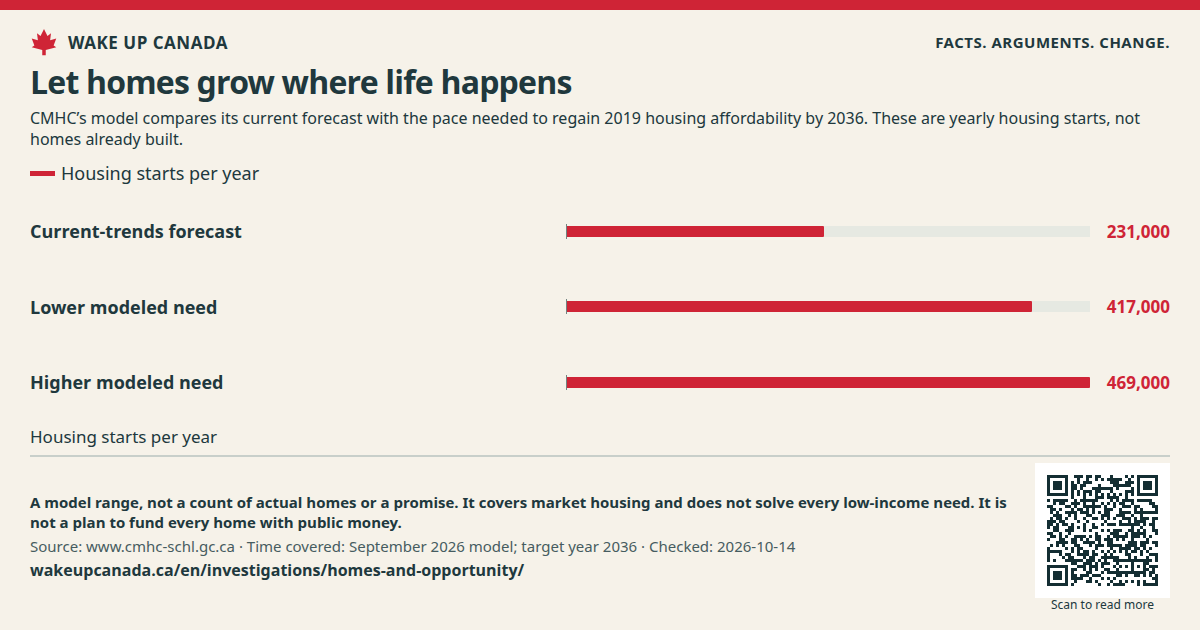
Open the door to useful homes, short trips and more choice. Keep the housing evidence honest.
Read the report ↗