The gap remains.
The two rates differ by 9.2 percentage points in 2025. Both use the same age range and survey scope. Each rate counts the share of that group in work, not its share of all jobs. [1]
Report · Published
A gap in access to work remains for Indigenous adults in this survey. There has also been progress. Show both, then act with the people affected.
The two rates differ by 9.2 percentage points in 2025. Both use the same age range and survey scope. Each rate counts the share of that group in work, not its share of all jobs. [1]
In 2007, the shares were 69.7% for Indigenous adults and 82.3% for non-Indigenous adults. The gap was 12.6 points. By 2025 it was 9.2 points. [1]
The share in work was 74.3% for Indigenous adults and 83.5% for non-Indigenous adults aged 25 to 54 in 2025. This gap deserves action. It is not a verdict on a people, a place or a single policy.
The survey leaves out reserves, Indigenous settlements and all three territories. It covers civilians outside institutions. These rates cannot speak for all Indigenous people in Canada.
The source has separate First Nations and Métis rates, but no separate Inuit rate. Those two subgroups do not add up to the full Indigenous group. We do not stack them or invent a missing rate.
[1]Ask Indigenous groups and job seekers which barriers matter in each place. Test help with training, child care and safe, reliable travel. Work with employers on fair hiring and paths to move up.
Set goals with those groups. Publish what changed, how much it cost and who gained. A national gap is a reason to investigate; it is not a licence to impose one plan everywhere.
A job rate does not show pay, hours, safety or whether work fits a person’s skills. Track those too where the data is sound. Respect local choices about how information is used.
The age range is the same, but the mix of ages within it can differ. Survey error and other factors also matter. This table gives no margin of error, so small shifts need care.
[1]The gap narrowed over this period. A story of unbroken decline would be wrong. Nor does the remaining gap prove one cause. Keep progress visible, avoid blame, and test proposed fixes with the groups they are meant to help.
[1]Let affected Indigenous groups help define the goals and the measures.
Test support for skills, child care, fair hiring and travel to work.
Show progress, costs and limits. Do not hide results that challenge the campaign.
Indigenous governments and groups, employers, and federal, provincial and local offices.
Training, child care and travel plans need budgets. Set costs and tests for each plan. No national price tag is yet claimed.
Each chart has its own dates, sources and limits. Open it to see the full data and download the figures.
A fair chance
More people should have a fair chance to work. These survey rates show a gap for Indigenous adults aged 25 to 54. They also show progress since 2007.
2025 · Share of the age group in work (%)
See the chart and the case ↗Source title in English
WAKE UP CANADA
Help more people see the facts and the plan.

A gap in access to work remains for Indigenous adults in this survey. There has also been progress. Show both, then act with the people affected.
Keep the source, date and notes with the image.
Checked:
What this does not show: This survey leaves out reserves, Indigenous settlements and all three territories. It covers civilians outside institutions. It does not speak for all Indigenous people in Canada. The table has no separate Inuit rate and no margin of error. The group weights use census counts and estimates of how the groups have grown.
No account needed. Sharing does not sign you up for email.

If the image opens in a new tab, press and hold it or use your browser’s save tool.
This supports the whole cause. Emails are a separate choice.
Support totals are not available right now.
Each email counts once per cause. This does not sign a petition. Your name and email stay private. Only the total is public.
Government that works · Report
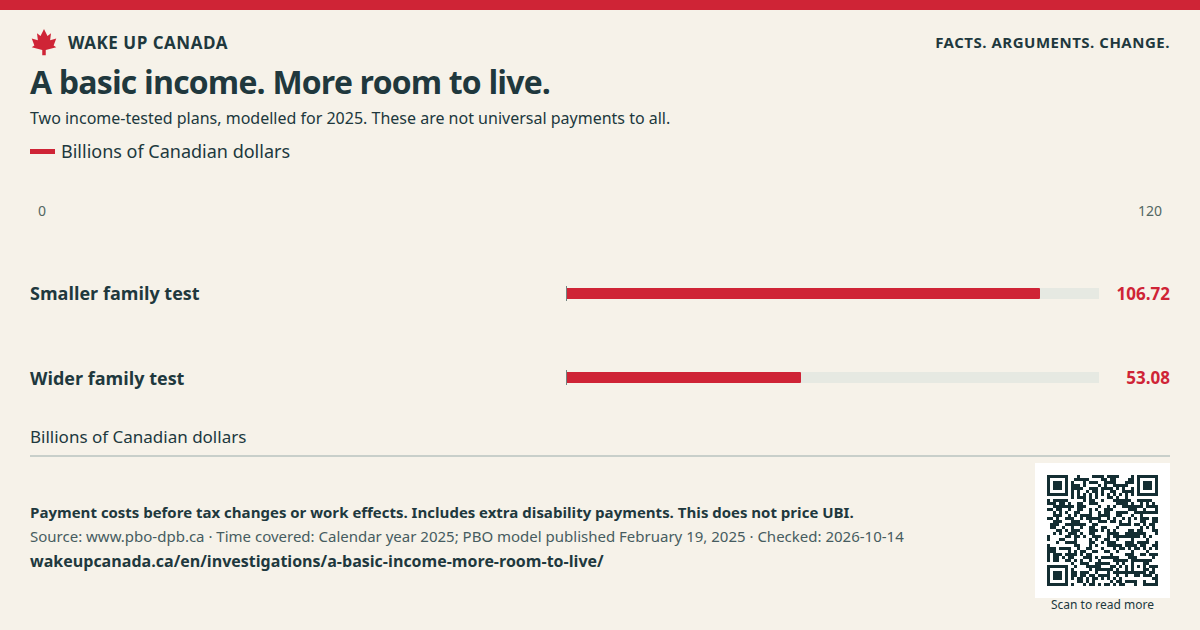
We support universal basic income. The next job is to build it well, fund the tests and show the whole bill.
Read the report ↗Government that works · Report
Lower taxes at every level. Compare clear family cases and show how to pay for each cut.
Read the report ↗Government that works · Report
Lower the tax cost of starting and growing a firm. Judge the whole set of rules, not one rate.
Read the report ↗